2012 Voter Turnout Likely To Be Lowest In Eight Years
If the results of a new Gallup poll are correct, voter turnout on Tuesday isn’t likely to be as high as it was four years ago, or eight years ago for that matter:
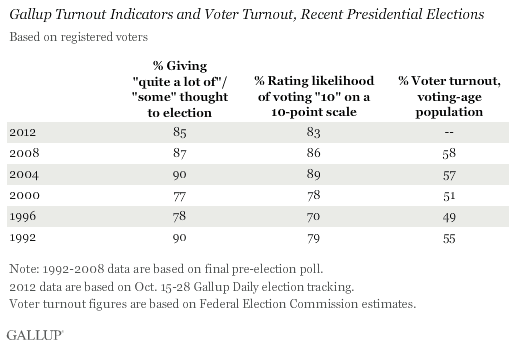
PRINCETON, NJ — Key Gallup indicators of voter turnout, collected prior to superstorm Sandy, suggest voter turnout will fall short of what it was in 2004 and 2008. U.S. registered voters report giving less thought to the election, and are less likely to rate their chance of voting as a “10” on a 10-point scale, than in 2004 and 2008, two higher-turnout elections. However, the 2012 figures are higher than in 1996 and 2000, two lower-turnout elections.
The questions are two of the seven that factor into Gallup’s likely voter model. The model assesses individual respondents’ likelihood of voting by asking about current voting intentions and past voting behavior. “Election thought” and the 10-point “likelihood of voting scale” are the two questions that focus on current voting intentions and show the most variation from election to election.
Here’s the chart:
Gallup explains:
As the above chart indicates, in years like 1992, 2004, and 2008 when turnout was greater, more registered voters have tended to say they are giving at least some thought to the election, and to rate their likelihood of voting as high as possible. The percentages on these questions were lower in both 1996 and 2000, when proportionately fewer Americans voted.
Thus, the current data suggest turnout could fall in between the lower levels of 1996 and 2000 and the higher levels of 2004 and 2008.
It’s hard to say what impact this could have on the election. Lower turnout in solid blue or red states doesn’t mean much of anything, although it could contribute to the possibility of a Popular Vote/Electoral Vote split. Lower turnout in swing states, though, would clearly impact the election which is why you’re going to see a lot of “Get Out The Vote” efforts over the next six days.


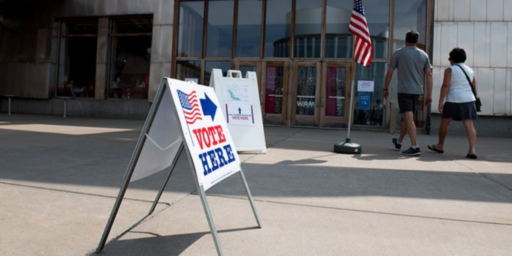
It’s tough to get all that excited about voting when you can’t find a job, your house is in foreclosure and your kids’ college degrees are worth about the same as toilet paper. Plus Romney is a Mormon and Obama isn’t half the man he used to be.
I can think of a number of reasons voting turnout to be going down:
1. People are busier than ever. Voting becomes just one more thing to do.
2. Increase awareness due to polling that unless the vote is close in your state, then your vote may not count for much.
3. The length of the election process just makes folks just flat out weary of the whole thing.
4. Even though there is an increase in the number of news channels (internet, cable, newspaper, blogs, etc) the quality of the content seems to be much more highly variable and lower in general.
It would be a lot more useful to get the potential turnout data in swing states. If California and Texas have lower than normal turnout, that doesn’t affect the outcome. Ohio and Virginia, on the other hand, will matter.
I would also caution that there’s a lot more early voting than in 2004. Certainly some early voters are people who would have voted on election day anyways. But, it’s equally certain that a healthy number of people who vote early would not have voted on election day otherwise. Also, campaigns (at least on the Democratic side) have gotten much better at identifying unlikely voters and pushing their rear-ends into the voting booth.
We’ll see shortly.
This is part of Gallup’s problem, not a result to take seriously. Their model assumes people who support Obama won’t turn out, and then predicts a win for Romney.
Let’s not put all our eggs in the “trusting Gallup’s likely voter model” basket.
Recycled from another thread…
The real surprise of Sandy is that it may contribute to a Popular Vote/Electoral Vote split. Any drop in turn out due to the storm won’t be enough to flip the (solidly blue) affected states. Nor do I think, like some liberals, that Obama’s response (or Romney’s past talk of cutting FEMA) will change many votes. But the disaster condition left in Sandy’s wake could create enough of a reduction to give Romney the edge in the popular vote.
And, personally, I’d love to see a Popular Vote/Electoral Vote split this year (provided Obama wins the EV) — count me on team “Taylor”, I think Electoral College reform is long overdue, and a Republican Win/Loss might make all the difference in getting it done.
For what it’s worth a single Gallup poll has been continually pointed to as evidence that Carter was leading Reagan into the 1980 election. As Doug has previously written, that poll was significantly out of step with most others at the time which showed Reagan leading for quite a while prior to the debate.
Didn’t someone post about the meaningless headlines, such as “No election has ever been won without X” and “Y has been proven true for decades of Presidential Elections”? The headlines have little value because of the scant data points involved (i.e., a very small number of elections). And now, a headline about the last three?
“2012 turnout to be smaller, or larger, than 2008!”
Grumble.
@John Peabody:
No nominee with a k in their first name has ever lost.
I can’t help noticing that in Gallup’s own chart, the connection between “a lot of though” about the race and rating your chances of voting as a 10 don’t have a real high degree of correlation with voter turnout. In ’92 the numbers were 90/79 with a turnout of 55%. In ’04 a 10% increase in the number of “10” responses resulted in just a 2% increase in turnout. In ’08 the numbers were lower than ’04, but turnout was higher. This tells me that the correlation is imperfect at best.
Also, the results from previous election were the final poll, not a poll taken at a corresponding time. So even if these questions were able to correctly predict turnout (which they don’t seem to), they would be totally irrelevant in predicting turnout this year because we aren’t looking at the numbers from 2012’s final poll.
An apples-to-apples comparison would either have to wait for Gallup’s final poll, or look at data from about a week before the election in the previous years.
@John Peabody: @John Peabody:
http://xkcd.com/1122/