U.S. Defense Spending Below Average?
 The U.S. Defense Budget is, to put it mildly, rather large. The FY 2008 budget authority for defense is a staggering $508 billion, with expected outlays of $516.5. As has been pointed out numerous times here and elsewhere, we’re quite literally spending more on defense than all other countries on the face of the earth combined. (Click thumbnail for a rather gigantic budget table.)
It’s rather interesting, then, to see that our defense spending, when measured as a percentage of gross domestic product, is actually well below our 45 year average:
The chart is one of many interesting graphics in the new Heritage Foundation Federal Budget Chart Book, which my friend Robert Bluey, the new director of Heritage’s Center for Media & Public Policy, has been writing about.
One could argue that the “45 year average” baseline is somewhat skewed, given that the first three or four years of that range represented the height of the Vietnam War. Then again, the past five years include two significant ongoing wars in Afghanistan and Iraq and the larger “global war on terrorism.” Further, current spending as a function of GDP is well within the range of normalcy for the post-Cold War period.
I’ve never known what to make of GDP/spending ratio arguments. It seems to imply that these ratios should remain static, which not only creates a presumption for the status quo but presumes that the relative merits of various type of spending are not influenced by changing circumstances. Regardless of our national wealth, it made sense to cut spending on defense once the Soviet Union collapsed and to increase it again in the wake of the 9/11 attacks. Moreover, it’s not clear why the increased productivity of the American worker should necessarily give the government a claim to more money.
Perhaps expenditures in real (inflation-adjusted) dollars makes more sense. In that regard, spending is clearly up:
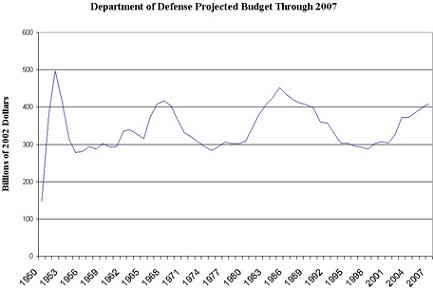
The table above, from Brookings’ Michael E. O’Hanlon, was constructed five years ago, using projections for the out years, so the graph is a bit off, but it’s close enough for eyeball comparisons with the Heritage chart. (Global Issues has updated real dollar figures through 2007 but their chart only goes back to 1998, providing a poor comparison with the Heritage chart.)
As you can see, there are wild swings in real defense spending which more-or-less correspond to perceived changes in the strategic environment. The constant dollar charts seem to track more closely in that regard than the percentage of GDP chart.
I can’t tell from the link: does the Heritage study take into account that the bulk of operational budgeting for Iraq and Afghanistan have been through “emergency” appropriations, rather than the normal budgeting process?
Alex: A fair point that had occurred to me as well. And, no, I can’t tell, either.
I had the same question as Alex — the costs of these wars are running over different sets of books, and I have all the faith in the world that the AEI would skew these numbers dishonestly any way they can. Remember that the official numbers allocated $0 for Afghanistan at least one year.
Based on the tables’ use of the word “budget,” my bet is that they don’t include the off-budget appropriations for Iraq/Afghanistan – thin, admittedly.
Comparing the defense budget as a share of GDP or any other measure in the draft environment and the volunteer military had to be done with great care.
In the draft military enlisted personnel were basically paid cigarette and beer money. but in the volunteer military the enlisted personnel have to be paid market wages. It is significantly more expensive to sustain the same manpower in the voluntary military as in the draft military.
Another major problem with this accounting is that it only looks at DoD spending.
As if the tens of billions spent by the DOE, DHS and other agencies on national security aren’t part of national defense expenditures.
As regards Alex’s question, I’ve one to add… in the interests of all those historical datapoints being on the same charted scale… how much of the historial need for military funding was also done under “emergency appropriations”?
To Andy’s comment I would add that it seems only fair that when wars are paid for by borrowing money (as this one has been), the future interest paid on the incurred debt should also be counted as military spending.
My question would be why is % of GDP the baseline? What about % of total revenues? GDP is not what makes up the tax base. Income , corporate, excises and payroll tax is. There are many things in GDP not taxed and never were.
It’s unclear to me whether the figures include the money spent on the VA system and military pensions which should presumably be included as well.
It seems to me that whether you compare our defense spending to other nations’, historical ratio to GDP, or level in real dollars is largely irrelevant. You spend what you need to spend to undertake the tasks you use your military for. Yes, we spend more money than other countries put together. In part it’s our spending that enables that. And ours is the only navy patrolling the sealanes and able to respond to disasters like the tsunami, too.
All sorts of things are bundled into our military spending: we’ve educated our kids with it (I went to school in part on an NDEA loan), built our roads with it, and it accounts for a big part of our healthcare system.
Could we spend less? Hell, yes! We could also undertake a lot less with our military and we’ll need to do that if we are to reduce our military spending considerably.
Defense is a fascinating topic with respect to budgets and baselines. In almost all business endeavors, technology and productivity improvements over the last 45 years have massively reduced the cost of, ahem, doing business. One would think that this combined with the falling force structures should have driven our defense budgets down considerably. Except, of course, for the new weapons systems, new technology, new technology infrastructure, new enemies, new tactics, etc.
It would be interesting to see a study that examined what it would cost today to provide what we had 45 years ago in order to understand what percentage of the defense budget is structural or systemic and what percentage is driven by the need to stay in front, which I, for one, strongly advocate.
I agree that we should stay ahead, charles. The question is how far ahead? For example, the U. S. has 11 (I think) supercarriers. No other country has any.
Supercarriers produce a built-in market for planes, men, etc. How large a fleet do we need?
The answer, as I suggest above, is what use we believe our navy will be put to.
Because the total tax take in today’s dollars isn’t the only issue. A measurement of teh state of the economy also plays into the real spending habits.
% of GDP and % of total revenues are both relevant. The last time I saw the comparison of % of total revenue, military was on a constant decline. Not surprising since the increase in social programs have been increasing at a good rate.
I’m not sure what a “study that examined what it would cost today to provide what we had 45 years ago†would tell use beyond trivia curiosity. That would be asking what it would cost to buy swords and equipment of the Roman army today. Interesting but it is not really relevant to equipping a modern day military.
…I do believe the Iraq occupation is off-the-books…so your numbers are comparing apples to oranges.
…Do the math on the whole “war-on-terra” and you will see where our Clinton Surplus went and where today’s record deficits are being run.
…but not to worry, we always have the Bank of China to draw from for our expeditionary wars. And we know they will never call the note…right?…right?