The Bureau of Economic Analysis is reporting that the U.S. economy shrank at a 0.3% annual rate in the third quarter.
Real gross domestic product — the output of goods and services produced by labor and property located in the United States — decreased at an annual rate of 0.3 percent in the third quarter of 2008, (that is, from the second quarter to the third quarter), according to advance estimates released by the Bureau of Economic Analysis. In the second quarter, real GDP increased 2.8 percent.
Not that surprising with all that is going on.
What is driving the reduction in GDP? Reductions in personal consumption expenditures.
The decrease in real GDP in the third quarter primarily reflected negative contributions from personal consumption expenditures (PCE), residential fixed investment, and equipment and software that were largely offset by positive contributions from federal government spending, exports, private inventory investment, nonresidential structures, and state and local government spending. Imports, which are a subtraction in the calculation of GDP, decreased.
Personal Consumption Expenditures (PCE) is the largest component of GDP coming in at about 70.6% of GDP. So, when consumers decide to stop spending money, or at least spend less it can be a problem in terms of economic growth.
This article points to a less than stellar outlook for the labor markets as well,
Separately, the Labor Department said weekly claims for new unemployment benefits were unchanged at a lofty 479,000 last week, a level that signals weak hiring prospects.
The U.S. economy has shed jobs in each of the last nine months, with about 750,000 lost so far. On Thursday, American Express said it would cut 7,000 jobs, while Motorola Inc said it would let 3,000 workers go.
Mass layoffs — involving 50 or more people — hit their highest level since September 2001 last month.
I think it is fair to say it will likely get worse before it gets better.
Update: Forgot to add, these are advanced estimates and are subject to revision over the coming months. It could turn out that growth will end up positive but equally low. It is unlikley however, that growth will be comparable to the second quarters 2.8% annual rate.
UPDATE (Dave Schuler)
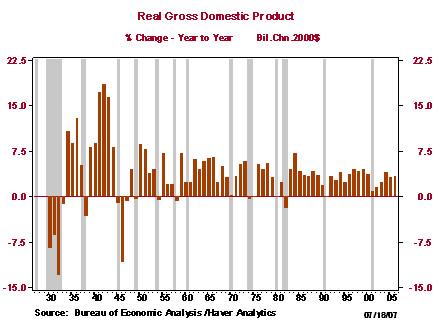
To place this degree of contraction in a little perspective here’s a chart of year-to-year GDP change from roughly 1930 to 2005:

Way over there at the left are the early years of the Great Depression of the 1930’s, during which the year-to-year contraction of the economy was in the vicinity of 6% to 12% per year, or 20 to 40 times the annualized decrease of which Steve appropriately takes note.
I don’t mean by this to disregard that some people have lost their jobs or deny that the economy has, indeed, contracted. I’d just like to stave off the comparisons to the 1930’s a bit.
Update (Steve Verdon): Quite agree with Dave’s point. This is not 1930. The economy is taking a beating, but anyone trying to argue we are heading into a depression at this juncture either has a really nice crystal ball or is being foolhardy.