The Marriage Gap
A new poll reveals a stark gap between the voting preferences of married and unmarried voters, but that shouldn't be much of a surprise.
Yesterday’s Quinnipiac University’s national poll of the Presidential race, showed President Obama leading Mitt Romney by 46% to 43%, a number that’s within the margin of error, but that’s not what got the attention of many political pundits:
Unmarried voters support Obama by a 20-point margin, 54 percent to 34 percent. But married voters prefer Romney, 51 percent to 38 percent. Single women support Obama by a 2-to-1 margin, 60 percent to 31 percent. Married men back Romney, 54 percent to 35 percent.
“Although much has been made about the gender gap and how … Obama’s lead among women fuels his campaign, the marriage gap is actually larger and more telling,” said Peter Brown, assistant director of the Quinnipiac University Polling Institute. “The marriage gap may be related to the different priorities and economic situations of married and single people.”
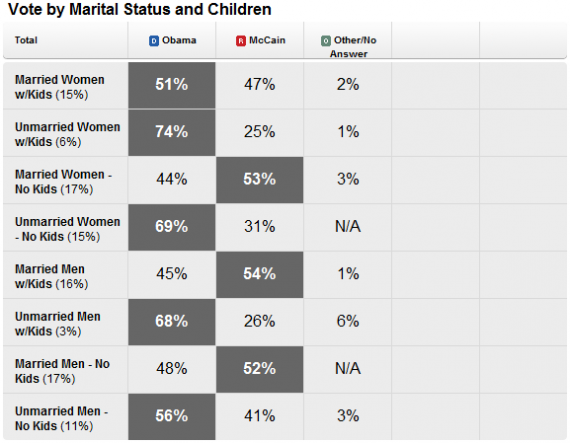
This isn’t a new development, as the 2008 exit polls show us:
The breakdown is more interesting when you break it down by marital status and whether they have children:
Most current polling doesn’t appear to make the same kind of detailed breakdown among married men and women with and without children as they did in the exit poll, but one suspects that the numbers in 2012 would be roughly the same, especially among women where Obama maintains the same advantage he has for months now in poll after poll. In many senses, though, Mitt Romney seems to be doing much better among unmarried people than John McCain did on Election Day 2008, but that is likely mostly a reflection of the fact that the polls are, at least at the moment, very close and it’s rather clear that we’re not going to have the kind of election we did four years ago. Nonethless, the gap is still there.
Part of the explanation for this wide disparity among married and unmarried couples, no doubt, is related to age. Unmarried people are more likely to be young, after all, and younger voters have been among the President’s strongest supporters since he first ran for President (although they didn’t exactly have the impact on the 2008 election that some people thought they would). Additionally, as Brown said in a separate interview, the reality is that married and unmarried people have different priorities:
“Married people are more likely to be older, more financially secure and more socially conservative than unmarried voters. The married column includes more Republicans and more white voters,” said Peter Brown, assistant director for the Quinnipiac University Polling Institute, in a statement released with the results. “Married voters are more likely to focus on the economy and health care, while single voters are more focused on issues such as gay rights and reproductive issues.”
This seems about right. It’s not so much that married voters stop caring about social issues the minute they say “I do,” or that unmarried voters don’t start caring about the economy until they walk down the aisle, it’s just that you’re looking at two demographic groups with two very different life priorities. I’m not even sure that there’s anything in these “marriage gap” that requires campaigns to do anything different. After all, the message that appears to married voters is going to be the same message that likely appears to over-3o, middle class voters. Similarly, the message that appeals to unmarried voters will also be the one that appeals to younger voters. So, yes, the gap between married and unmarried voters is interesting, but I don’t think it tells us much of anything we didn’t already know.




“Married voters are more likely to focus on the economy and health care”
If that’s why they favor Romney, that would seem to indicate that getting married makes you stupid, particularly if you’re a man.
Mike
But, I thought the primary purpose of marriage was to procreate? Of course, Catholics and Mormons do not care about reproductive issues – because there is no issue, just obey the Church and have the kids.
Age, race, maturity levels and social standing are all key factors, but the elephant in the room is that married people tend to have a lot more to lose by being airheaded and thus by necessity are far more likely to be clued in.
Or married people are more likely to pay taxes: Married taxpayers pay roughly 75 percent of all federal income taxes, despite filing only 40 percent of returns.
Married people (typically with two incomes) are more likely to be economically secure than unmarried. Economic security seems to be a factor also in these divisions.
@PD Shaw: That sounds far less dramatic when you stop and consider that each of those married tax returns covers two adult taxpayers instead of one.
@PD Shaw:
It’s like married people have twice as many people per return because they’re filing jointly or something…
@Stormy Dragon:
LOL
@Gromitt Gunn: @Stormy Dragon: I don’t read the quote that way. “Married taxpayors” is the subject of the sentence, not the return. I’m a married taxpayor and my wife is a married taxpayor and we both filed a return.
From the link: Of those people who pay zero federal income taxes:
68.8% are single (either filing as head of household or single)
31.0% are married (either filing jointly or separately)
I’m not sure why this would be surprising.
And the quote has to do with the amount ($) paid by married people, not the number of returns they file.
@PD Shaw: Yes, I have three of those unmarried deadbeats who may zero income taxes in my family: my widowed 86 year-old mother and two teenagers who earned about $1500 each last year in summer jobs.
@Scott: If you think I wrote that people who don’t pay taxes are deadbeats, you’re an idiot.
@PD Shaw:
From the most recent statistics:
Single returns: 62,819,226
Heads of Households: 21,496,275
Married filing jointly: 53,639,038
Married filing separately: 2,539,588
You and your wife are a tiny percentage of taxpayers; more than 95% of married couples file jointly, which is why they’re only 40% of returns yet 75% of the taxes: because each of their returns cover two people.
@PD Shaw:
No.
You’ve chosen to highlight a quote from that study that deliberately attempts to distort the percentage in $ of taxes paid compared to the # of filers by using the number of returns filed rather than the number of individuals covered by those filings.
40% of returns are filed by married filers. I am going to assume that 100% of those are filing joint returns because a) separate returns are very rare due to their punitive nature and b) it makes the math harder to type out.
So, your population of returns in 1000. 40% of them are married joint and 60% are single or head of household. However, you don’t have 1000 people, you have 1000 returns. You actually have 1400 people ( (400 * 2) + 600). So actually 800/1400, or 57% of the people are paying 75% of the federal income tax. Which, as I noted is much less dramatic (and thus distorted deliberately by the Tax Foundation).
In case I was not sufficiently clear, my issue is not with PD Shaw, it is with The Tax Foundation, which is highly prone to this sort of obfuscation and actively encourages things like the myth that only 53% of Americans are taxpayers.
@PD Shaw:
From previous source, returns with no adjusted gross income:
Single Returns: 1,507,123
Heads of Households: 110,894
Married filing jointly: 805,201
Married filing seperately: 88,707
So again, your 68.8% figure relies on confusing the number of returns with the number of taxpayers.
@Stormy Dragon: Again, I don’t read the sentence that way, its talking about who pays the income taxes as measured in dollars. From my link, two-thirds of Head-of-Household returns show no tax owed; in fact, they probably are filing returns to get paid their earned income tax credit.
@Gromitt Gunn: Put the source aside for a minute, do you accept the proposition above that :Married people are more likely to be older, more financially secure”? And if you do, why wouldn’t they be paying far more of the income taxes than unmarried people.
@PD Shaw:
I don’t care how you read the sentence, the numbers don’t work out if you read it that way.
@PD Shaw: No, I don’t. Now you’re ignoring elder poverty, as well as widows and widowers. And the fact that as people retire their marginal tax rates drop as they substitute earned income for investment income.
If you amend to ask if I think there is a curve and that people with the highest federal income tax burdens expressed in dollars tend to be married people in their 40s, 50s, and early 60s, I would agree with that.
I don’t know if you can break things down purely by economy vs. social issues. That suggests people see politics on a macro rather then personal level. But that’s not really the point I want to make right now.
The economics in 2008 suggested that the incumbent party lose overwhelmingly. The populations that deviated from that are the ones that need explanation. I tend to see conservative (in disposition rather then ideology) voters as being people that reach for a status quo in the midst of turmoil and during good times still want a status quo, but tolerate change much easier. That turmoil could be economic, it could be during social unrest, it could be during war, etc. Generally speaking, I think married voters fall under people that have a conservative disposition because married people in America tend to be more privileged. The guy that will win the vote of privileged (married people are whiter, richer, straight, etc. compared to the population) people will be the guy that clings most to tradition/value/status quo.
I think part of the reason Romney isn’t running away with this election is because after a certain point, the right ceased being conservative and turned radical. That cedes too much of the electorate which should be turning on Obama, to Obama. Obama is becoming the default “let’s ride this thing out” choice.
@PD Shaw: Sorry, since you were writting about the so-called non income taxpaying I just inferred that from what you wrote and how you wrote it. I guess I’m just an idiot for not knowing the difference between what you think and what you write about what you think.
This is a no brainer. Just empirically, how many times have you met married women that merely parrot their husband’s political choices? Especially in the south. A geographic, regional breakdown would be mighty interesting, especially in the Bible Belt “obey your husband” red states. I’ll bet, in those states, the correlation between husband and wife voting is 98%.
“Marge, if you vote for that half wit N word who is destroying america, I will slap you twice as hard
next time you deserve it.”
Once women are freed from the yoke of husband dominance….well, just look at the stats.
I don’t think it tells us much of anything we didn’t already know.
I think this sums up every single one of Doug’s posts, ever.