US Tax Rates by Quintile
The Bush tax cuts were much more progressive than you probably think.
Regular commenter John Personna flags this chart at Econbrowser:

The chart, presumably crafted by Menzi Chinn, is compiled from CBO data and is presented as a continuation of a discussion from a couple years back sparked by an infamous column by Todd Henderson complaining that rich people aren’t so rich as people think, once one deducts the perquisites of a rich person’s lifestyle such as a huge house, private schooling, and a full time nanny. It’s also somehow supposed to undermine “beliefs held in the fevered imagination of some commentators that taxes have risen enormously under the current Administration.” How it does that, given that it ends with the Bush administration, is not immediately clear to me. But then, I’m not an economist.
Regardless, two things strike me as interesting here.
First, the top quintile is lower than commonly imagined. President Obama is proposing to extend the Bush tax cuts for those making under $250,000 and even many Democrats think the threshold should be $1,000,000, which they consider more in line what it means to be “rich.” But even the $250,000 figure is well into the fifth quintile–and more than twice the entry threshold for the fourth quintile. Indeed, as shown by a second chart, we’re talking about numbers above the 95th percentile.

Of course, being in the top 20 percent–or even the top 5 or 1 percent–doesn’t necessarily make one “rich.” That’s as much a philosophical concept as a numerical one. Indeed, for all but the mega-rich, “rich” is generally somewhere well north of their own income because, after all, they have financial worries and limitations on their purchasing power.
Second–and this is particularly striking–the nature of the redistribution of the tax burden is substantially more progressive than I’d imagined. Because the top tax has declined dramatically while the lower rates have not, I’d have assumed that the burden on the highest quintile would have plummeted. It hasn’t.
The Econbrowser chart starts with the last year of the Carter administration and ends with the last year of the Bush administration. When Carter left office, the top marginal rate was a whopping 70 percent, as it had been since 1971. When Bush left office, the top rate was 35 percent–down from Clinton tax hike of 39.6 percent but higher than the 31 percent tax hike that helped drive his father from office. Yet, in 1979 the top quintile was paying what looks to be 27 percent*; in 2009, they’re down to something like 24 percent. By contrast, the lowest quintile went from 7.5 percent to less than 1 percent. And the second quintile went from nearly 14 percent to just 6 percent. In terms of raw percentages, then, the lowest quintiles got a much steeper cut.
Now, of course, the percentage rates don’t tell the whole story. A 3 percent cut for those making $148,100 yields more than a 6.5 percent cut for those making nothing. But in terms of sheer rate progressivity, the trends have actually been much more favorable to the lower quintiles than advertised. That’s doubly true for the Bush tax cuts, which virtually eliminated the federal tax burden for the lowest two quintiles.
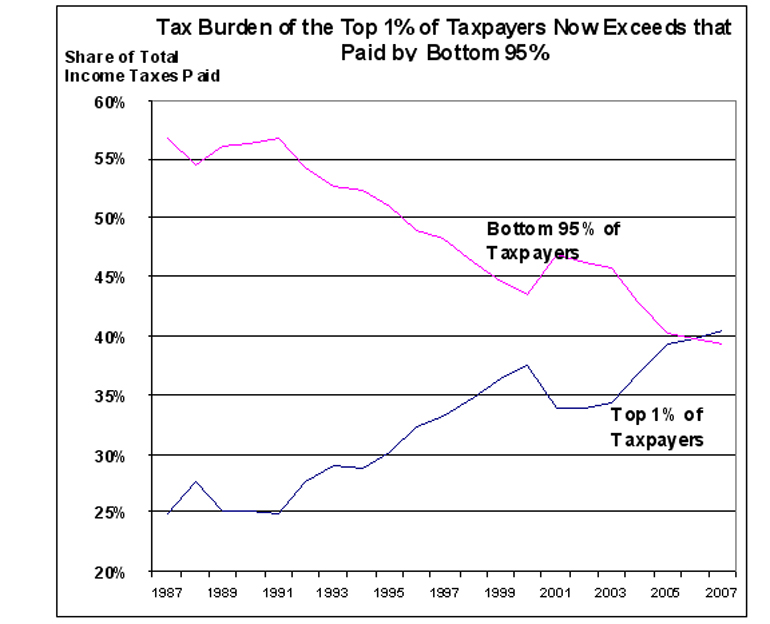
Even moving to the second chart, we see a steeper decline for “all households” than we do for the 96-99 percentile group. And, shockingly, the top 1 percent actually saw a spike in their average tax rates the last year of the Bush administration. Even going from the Bush peak of 32.5 percent to the trough of 29.5 percent, it’s a relatively modest decline compared to the drop from 23 percent to 17.5 percent drop for “all households.”
Now, again, rates don’t tell the whole story. Because they make more money–radically more money in the cases of those in the 99th percentile and especially its upper reaches–the top earners got a much bigger windfall than those near the bottom in terms of actual dollars pocketed. Those near the bottom of the economic ladder never paid much in terms of federal income taxes; indeed, only the very highest earners paid income taxes at all in the early decades of the system. But it’s interesting, indeed, that in terms of rate progressivity–the notion that those with the ability to pay more should pay more–the Bush tax cuts met the goal that Democrats have espoused for decades.
UPDATE: See also Dave Schuler‘s posting on this from yesterday, in which he focuses on Chinn’s statement that “there is no obvious correlation between the tax rate applying to the top quintile and per capita GDP growth.”
_____________
*I’m having to interpolate the exact numbers, since the Y-axis is shown in large increments.


My main take-away was that tax rates are low for everyone, and that we have a real revenue problem. That’s easy to see.
After that, we can divide down the details a bit. I’d note that a top quintile probably isn’t “rich.” It is too large a bucket and not at all elite. You get up to the 96th percentile, and $277K, then you are talking something pretty elite. The top 1% and $566k, more so.
… but pretty much if you want to restore revenues, then everybody’s tax cuts have to go away.
Yeah, I linked to this post yesterday. The income quintiles and what constitutes being “rich” is a topic I’ve returned to from time to time. Just as a handy reference: the top quintile starts at about $85,000, the top 1% starts at about $300,000, and the top .1% starts at about $2 million annual income.
Rich is in the eye of the beholder. I think the most commonly used definition is “whoever’s in the niche just higher than mine is rich”. That’s reflected in remarks made by Congressmen nearly every day. I don’t think that the top 1% are necessarily rich. I would use the term “well off”. I’d reserve rich for the top .1% and ultra-rich for the top four or five hundred of those.
These graphs strike me as rather meaningless.
Until you start talking about effective rates and rates of capture you aren’t getting the entire story.
I do remember tracking my take-home after the 1st round of Bush 43’s tax cuts and it increased $6. About $300 a year. The top percentile, according to these charts, dropped something like 7%…probably much more than $300.
FYI…Yglesias has some interesting numbers regarding the $250,000 figure.
http://mobile.slate.com/blogs/moneybox/2012/07/12/median_household_income_in_the_new_york_area.html
Why is it that we always seem to dwell on the revenue side of the equation? Is it because it is easier to compel people to give up part of their income rather than give up part of their benefits?
While the national economy is significantly more complex than JP’s, Anjin-san’s, James’, Reynold’s or mine, ask yourselves: What do you do in your household if expenses exceed revenues and you can’t get a raise or borrow more money to pay your bills?
I think those are effective tax rates. I interpret them as the average tax percentage paid and average income for the specified group. The 1% averages $566k and pays 28%.
(Census data for 2010 says entry to the 1% is at $380K)
@Pete:
I can be open to anything that works, but I think we can start with what went wrong. Spending grew while taxes were reduced. The way to fix that, the direct way, is to reverse course on both fronts. Reduce spending and raise tax.
“Oh no we can only do one” is not really working.
@Pete:
The benefits from pulling back from overseas military operations and reducing our military to the size needed to defend our shores would be one I’d like to give up.
Military too is part (a major part) of big government – the part that the GOP can’t give up. Both Democrats and Republicans are in love with big government, just different parts of it. And that’s why taxes inevitably will have to rise to balance the deficit – neither party is willing to give up on big government, they just want to shuffle the dollars around. You see this in the actual deficit’s under the various Congresses and Presidents – no significant differences between parties.
I wonder where the quintile information comes from. Its not that I disagree with it but every google search I do yields different results.
I found this one. http://www.taxpolicycenter.org/taxfacts/displayafact.cfm?Docid=330 (but dated back to 2009) that shows the fourth quintile topping out about 100K. This one shows the Fourth apparently starting around 100K. Is this more recent information?
I found it. The econobrowser link has a link to an excel spreadsheet. Tab 4, contains income quintiles, but they’re broken down by household size. 1 thru 4. The quintile number on the graph (e.g. fourth quintile $100.2K) is for the house hold of 4 incomes.
@rodney dill:
4 incomes or “typical” family of 4, with possibly 2 wage-earners?
Windfall? Windfall??
How is keeping more of one’s own money via less taxation a “windfall?” Does the government have a possessory right to people’s earnings and incomes?
That aside, two other points are worth mentioning:
– The Bush tax cuts weren’t only about marginal income rates. They also reduced the tax rates on long-term capital gains and reduced the tax rates on most dividends. Nobody ever talks about those items. The media completely is insouciant. Why? Capital gains and dividends are very important to vast numbers of people. Shit, a lot of seniors out there rely on corporate dividends nearly as much or even moreso than their pensions, etc.
– Because of the ways in which the income tax code is structured (EIC, exemptions, deductions) as soon as you begin talking in terms of “progressive” rates for the lowest income tiers you’ve already left the building. The lower tiers in any event don’t pay any net income taxes. Zero. Nada. Zilch. That’s one of the major problems with our tax system.
Speaking of which, the concept of graduated rates doesn’t make any sense and has done more harm than good, especially given the fact half the populace has no real skin in the game and effective rates are so much different than marginal rates. If we have to have an income tax, and really we don’t, but that’s another topic for another time, the way to structure it is one flat rate with no deductions nor exemptions and the broadest possible definition of income. The “rich” obviously will pay a lot more dollars into the Treasury. And everyone will have skin in the game.
@Tsar Nicholas: Absent government, your gross annual income would be in the neighborhood of zero dollars.
@john personna: could even be just one income. It just says household size of 4, but I assume it could be up to four wage earners. The 1,2 and 3 household sizes have quintile ranges that are correspondingly smaller. It doesn’t show the quintile value, regardless of household size that I can tell.
@rodney dill:
… in Utah maybe
We have a very low income tax rate structure.
It causes one to wonder how we survived the Eisenhower Presidency, when the top marginal tax rate was over 90 percent. Who knew that the 1950s was our experiment with Marxism.
And now we’re locked up over increasing the top marginal tax rate from about 35% to 39% (where it was during the Clinton years.) I suppose that 4% increase is the difference between Capitalism and Marxism.
@Tsar Nicholas: It’s a windfall in comparison to the previous rates; an incremental gain that otherwise wouldn’t have happened aside from an event–the decision to cut tax rates.
@Tsar Nicholas: The argument for graduated rates is rather obvious: marginal dollars have decreasing value. If it takes, say, $35,000 a year to feed, clothe, and shelter a family of four at a subsistence level, any money taken from those earning $35,000 or less in the form of taxes is incredibly punitive; it means they’re now unable to meet basic life demands. For those making, say, $135,000 a year, taking, say, 30 percent of all income over $35,000 still leaves them with substantial discretionary income. For those making $1.35 million a year, they remain incredibly affluent even if we take, say, 40 percent of all income over $250,000.
@john personna: A middle aged family where the husband, wife, and two young adult or teenage kids have jobs would presumably all have incomes. Whether the kids file separate tax returns is another matter.
@al-Ameda: That’s a point I’ve made many times in this space. (See, for example, “Class Warfare: Framing the Debate.”) I prefer lower taxes. And I instinctively find the old 90 percent and even 70 percent levels confiscatory and unjust. The difference between 34 and 38, though, is a policy difference, not a moral one.
@James Joyner:
I have no idea why you want to slice that one so thin. The data Minzie shares was someone’s attempt at modeling the good old “family of four.” You can do other data, modeling DINKs and singletons, and that fine.
But certainly if you are looking at families of four (a) they would be overwhelmingly 1-2 incomes, (b) they would very rarely have more than 2 incomes, and (c) “Whether the kids file separate tax returns” would be straight up vital to that argument.
@john personna: John, I agree with you. But in the real world, wisdom suggests strongly that families save when times are flush because increasing revenues is much more problematic than decreasing expenses. It seems that you are suggesting it is alright to keep spending as long as the revenue stream keeps up. Obviously the revenue stream is gasping for air; not just because of low tax rates. So what do we do if the revenue stream dries up?
And you seemed to avoid answering the question of what you would do with your family and its expenses if you lost your job, had to take a pay cut, had to find another job at a lower salary, were disabled, etc. And what if you were contributing to your church or some civic organization that helped the indigent when you were making good money? What would you do if you lost your job or had to take a pay cut? Would you cut off your contributions or give less? Would you start to prioritize where you could spend your reduced amount of income? Or would you go to your wealthier neighbor and demand that he contribute to you because you are supporting the indigent? And if he refuses, would you go down to the local police station and demand they force your neighbor to contribute because you are doing something good for the less advantaged in your community while he isn’t? Please tell me what you would do if your personal revenue stream was reduced and you still had bills to pay?
Why should our government organizations operate without the same constraints that are placed on us as citizens? Why do we allow our politicians to operate beyond the constraints placed on us?
Pete,
“Why is it that we always seem to dwell on the revenue side of the equation? Is it because it is easier to compel people to give up part of their income rather than give up part of their benefits?”
1. because taxes as a percentage of GDP are near the post WWII low, while spending as a percentage of GDP is around average for that period.
2. because nearly everyone agrees that spending needs to go down as part of a long-term solution, but only one party feels that taxes need to be raised. Since the media tend to cover controversy, the part not agreed upon gets highlighted.
3. because the overwhelming portion of the federal budget is in items it would be politically painful to cut (Defense, Social Security or Medicare) and interest on the debt.
Now don’t be nasty. I’ve had two kids at home, going to college, and still earning money along with my wife and I.
I would have thought so too, I just wanted to see the number, regardless of size of household.
Did you look at the spreadsheet? The numbers that correspond to the 100.2 K for a house hold of 4. are 50.1, 70.9, and 86.8 for households of 1,2,3 correspondingly. There are significant jumps for 3 and 4 sized households, though that could be explained by more than just number of wage earners. People more settled in careers and having families could be more two wage earners with significant sized incomes.
@al-Ameda: I think it had something to do with the fact we were the world economy back then and GDP was so strong that people felt they could afford those rates. Another thing to consider is that the dollar was still linked to gold back then which gave it much more purchasing power than today. Your comparison of those times to today is missing some very important ingredients.
@Pete:
I’m not very typical, so I don’t try to model what would just be best for me. I really am looking at it in terms of the historic trends, and what worked in the go-go years of US growth. al-Ameda touched on that, maybe a little over the top.
The 60’s say, were great for America and Americans, even with higher tax rates. Shouldn’t we feel safe with a “higher” tax (from a 2000’s perspective) that is still far “lower” than those good old days?
Please, understand that we are uncharted territory with ultra-low historic tax rates, they aren’t working, and stubborn folk are telling us we can do nothing else.
@rodney dill:
Probably a combination of correlations and causation. Large families might be less-often divorced, for instance, and so have avoided that well-known financial whammy.
(I read somewhere that having been divorced is a top predictor for low 401K balance.)
Schuler’s comment in the update strikes me as both artful and stupid. Basically he’s arguing that we shouldn’t raise taxes on the rich because it may not raise GDP. This is a straw man argument. I’m sure if you nutpick you can find people who argue raising taxes on the wealthy will increase GDP, and given Chinn’s data I’d be tempted take a shot myself. But the argument being made publically is only that raising taxes on the rich will draw in some revenue and won’t hurt GDP.
I saw someone years ago describe a curve of income distribution in the US being like looking at a football field on edge, with one goalpost on the right. The curve rises only slightly from the 0th percentile to about 99.x% and then a huge peak. Data broken down by quintile, or even top 1% buries more than it shows.
In Winner Take All Politics Hacker and Pierson use the concept of “drift”. Drift is the idea that in the US government it’s very easy to do nothing, leaving things as they currently are. And leaving things as they currently are tends to favor those who are currently doing well. One of the effects of drift is tax bracket creep. A few decades ago, 250K$ income was really, really rich, top .1% or something like that. By simply allowing brackets to creep with inflation, the .1% have acquired as allies something like 4% of the population.
Data above the top decile is thin. Most sources apparently do a check off box thing with the top range being over 100 K or 250 K or something. Just like Romney’s 100K salary from Bain after he “left”. It was really a check box that said ‘over 100K’. Could be 10M for all we know. Picketty and Saez generated better data for the real top earners.
@Moosebreath: Couldn’t agree more. My point is why do we keep debating these issues in the context of our political model, as if it is the only model to follow? Can we not improve the political model? It seems that the only people who pay attention to the political model are ones who are economically well off enough to be somewhat insulated from its failings, and, as such, nibble around the edges as a hobby rather than for effecting serious change. Most of the rest of the people affected by the political model are too busy to pay attention or even understand how distorted the model has become.
That is why I tried to paint this tax debate in the context of a family and its finances rather than in the context of our current political and economic model. Argue all you want around the edges of a hideous tax code and of irresponsible spending by easily corrupted politicians, but it is akin to pissing in your swimming pool trying to raise the water temperature.
It drives me crazy when anyone points out the top marginal tax rates of the 50s, 60s and 70s and fails to point out that no one paid those rates. Why? The huge proliferation of tax shelters, which all high earners took advantage of.
Reagan and Tip O’Neill worked out a deal on taxes: In exchange for the decrease in marginal tax rates, the code would be tightened up and all those tax shelters used by the wealthy would cease to be legal. I’m not positive, but I think that this was also the time the EITC for the poor was introduced. Interestingly enough, tax revenues actually increased after the changes were instituted. Sadly, it was also the last major overhaul of the tax code, which is in dire need of an overhaul right now.
@Pete:
A better comparison would be on effective tax rates, rather than marginal. It would give a much truer picture of where we are now vs. then.
@Moderate Mom: Excellent point. Thanks.
@Moderate Mom:
Here is the data, total tax rate for various groups, since 1960.
The middle twenty is at 16.1 now, versus 15.9 in, literally, 1960, but that was before a climb. That climb lasted until about 1980 (and probably Mr. Reagan). It declined since, whiles spending did not.
(those are effective rates above, just not going all the way back to ’60)
@Pete:
The government is not an individual. An economic downturn causes government revenues to decrease, but also causes government spending on various “safety net” programs (unemployment, food stamps, etc) to necessarily increase. At the same time, because government makes up such a large part of the economy, many people believe that cutting back on overall government spending or raising taxes during a recession may make things worse (deepen the recession and make the recovery take longer). Our government also has different revenue options than individuals — it can (currently) borrow money at very very low interest rates and has the ability to adjust it’s income via changing tax rates.
For our government, fiscal prudence would be to reduce debt (or at least not increase it at a faster rate than GDP) during good times, whether that is by reducing spending or increasing taxes (or both). During a recession, debt will increase, but the overall debt load will not be so large because of previous fiscal policy.
@Pete:
I stand by my comment that our tax rates are at a low level by any reasonable historical standard.
As for the 90% top tax rate during Ike’s presidency? Well that was for purposes of sarcasm, however it is interesting that most Americans look back to the 50’s as an idyllic time, which following nearly 2 decades of depression and war, it surely must have seemed to be. The 90% top tax rate evidently did not cause us to lose our freedom. Nobody advocates a return to that rate, although conservatives would have us believe that a 4 point increase to the top bracket will do irreparable harm to America.
I think this is a huge reach. Did someone writing a large check to the IRS in 1957 really stop and think “It’s a lot of money, and I would love to spend some of it on a new house/car/vacation, but America’s GDP is so danged strong that giving all this cash to Sam is no problemo”…
Individuals tend to personalize their taxes, not look at the big picture. It’s human nature. It is also human nature to want lots of stuff, but not necessarily want to go through the pain of paying for it.
Both parties are in love with spending, they just have different wish lists. Republicans used to be the party of grown ups. Now they still love the spending, they just don’t want to pay the bills when they come due. Democrats, once the impractical dreamers, are now the adults who realize that if you buy a lot of crap, you have to actually pay for it sooner or later.
@john personna: Ah, no, I’m just pointing out that the scenario in question is likely not uncommon–I fully agree that the typical household of four is one or two adult earners.
@john personna: Interesting. I’ll have to file this chart away; I hadn’t seen the long-term trends for the lower brackets before.
@James Joyner:
I don’t think I’ve ever in my life met a family filing 4 earners on one return, but if you say “not uncommon” you must have seen it somewhere.
On the lower brackets, I worry that this is, for better or worse, propping up the “everybody is middle class” dream.
Remember, we dislike public housing and public transportation much more than in the 60’s. We don’t eve like apartments. Everybody should buy a house, and drive to it, ideally with 2 or more cars.
Neither party can accept the implications of a “someone gets to be genuinely poor” outcome.
This is obviously a complex topic, especially if we add in transfer payments, state and local taxes, untaxed benefits and various other effects.
I do think it’s important not to focus too much on marginal rates. For example, take a look at this chart of individual income taxes as a percentage of GDP since 1950. Marginal rates across the board were a lot higher then (ranging from 20%-90%) but revenues as a percent of GDP are about the same as they are today, which is to say that the burden of federal income taxes on the economy is about the same today as it was back then. Or if you look at the per-capita federal income tax burden in constant dollars, you’ll see it’s gone up over the years.
How can that be? As others noted, very few people were actually subject to the top rates (and there were something like 25 marginal brackets in the 1950’s compared to 4 today). Additionally even middle-income people utilized tax shelters and sought to get a lot of their income from tax free fringe benefits. So, focusing on marginal rates, especially the top marginal rate, doesn’t really tell us much.
Well, in fact, that´s more complicated. One of the big problems with the budget in the United States is that medical costs are too high. I know that because I live outside the US -outside the US people do not pay dozens and dozens of thousands of dollars for single surgeries and most doctors have a good standard of living, but they aren´t millionaires.
A solution to this problem would be to increase the number of doctors and to make states and cities build their own hospitals. But Medicare is still problematic because it´s overtly subsidized and because is too generous for a public health care system. You´d still had to make cuts in services.
Anyway, we are talking about deficits that are as large as 10% of the GDP, and in fact by percentage of the GDP the United States has the biggest debt in the American continent, losing only to Jamaica, Antigua and Barbuda, Barbados and Saint Kitts and Nevis. Taxes and spending cuts are necessary, unfortunately.
Not sure if this late entry will be seen by the people who have commented here, but here it is nevertheless. It helps to reinforce the point I was trying to make.
http://www.zerohedge.com/news/politicians-have-stop-doing-what-they-have-done-wwii-or-markets-will-do-it-them
@Pete:
So, which party is going to cut back seriously on all the big three: medicare, social security, and the military?
No one running is suggesting that. Romney wants to increase the military spending of all things, and doesn’t want to touch medicare. Obama doesn’t want to touch medicare or social security.
So, to balance the “family” budget, the only option seems to be to raise income, which means taxes. Its not a good option, but it seems to be the only game in town.
And imagine if we’re actually dumb enough to start a war with Iran without raising taxes to pay for it?
@george:
Except for, you know, the ~$500B cuts to Medicare made in the Affordable Care Act.
@george: I’m afraid you are right, but it will be another short term attempt to “paper over” the problem. Neither party has the courage to cut spending. It is an era of self serving cowards, including the voting public.