About that Unit Root Thing
A decade after the Great Recession, we now have data to answer the question.
Back in 2009 there was considerable debate about the efficacy of fiscal stimulus. In particular there was some discussion about the possibility of a “unit root” problem. The “unit root” problem is that the U.S. had invested too much in things like housing and human capital related to the financial industry. The problem is that these kinds of investments cannot be easily unwound—i.e. you can’t use a house to make cars, or tractors or grow soy beans. And human capital once acquired cannot be “un-acquired”. That is, once the human capital is acquired it cannot be simply re-tasked like a drill press or a forklift can be re-tasked.
Of course those in favor of fiscal stimulus poo-poohed the idea. In fact, Paul Krugman called the very notion of suggesting a possible unit root as evil. Brad DeLong indicated the idea warranted no consideration. That there was tremendous excess capacity in the economy and all we needed was for government spending to get things going again. Krugman in particular argued in rather Cheney-esque form that in terms of spending there really was no effective upper bound worth considering. That in the end we’d end up “owing the debt to ourselves” and so should spend until the economy started growing again. Deficits don’t matter and all that.
But now, almost 10 years on perhaps we can evaluate the validity of the claim of a “unit root” problem. The basic idea of a unit root problem is that when there is an “innovation” that the effects are permanent. That is, in the case of 2008 the lost GDP would be permanent. Or to put it differently any deviation from the trend would be permanent. The alternative view is that the economy is a trend stationary process, that is, any deviation from the long run trend is temporary and we’d return to the trend.
I went to FRED and downloaded the real GDP data for the United States and took logs of the data. When the data is suggesting an exponential pattern taking logs “linearizes” the data and allows those interested in doing empirical work to utilize linear methods like regression analysis. The real GDP data is shown in the graph below,
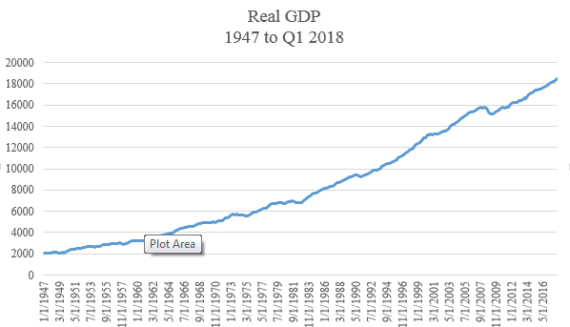
The data is from Q1 1947 to Q1 2018. The National Bureau of Economic Research has dated the start of the Great Recession as December 2008, almost 10 years’ worth of data.
To evaluate the validity of the unit root hypothesis I ran regressions assuming that the trend stationary hypothesis is true. That is the true model is depicted by,
![]()
This is a trend stationary model. An alternative to this model is,
![]()
This model incorporates the lag of the dependent variable, in this case GDP. If the coefficient for the time trend component, that is the Greek letter delta, is zero and the coefficient for the lag of the dependent variable is 1, then we have a unit root regime.
With a trend stationary process deviations from the trend are stationary and are due to the last terms in the equation above which is usually white noise or at least a random process. That is, after the deviation the process returns to the trend line. What causes one of these deviations? One possibility is an expectation of a bad (or positive) event that fails to materialize. Of if it does materialize the consequences were over blown. Once past that event people realize their error and things return to “business as usual” and we return to the long run trend.
The interpretation of a unit root is that we had too much investment in both housing and human capital related to both housing finance and possible finance in general. Why this is a unit root is that when it comes to human capital we cannot “unwind that position” quickly nor easily. Something like a lathe is useful in a variety of industries and when it is not being used in one industry it can be used in another. In the trend stationary world this is unused productive capacity. However, human capital is often specific to the industry in question and cannot be easily separated from the individual and sold to another party like physical capital can. In fact, it is also the case that human capital may be specific to a given firm and when that firm goes out of business that human capital is now essentially useless. And when it comes to housing an over investment in housing does not usually result in firms tearing down houses and trying to use those resources elsewhere. Broken wood and crushed stucco do not have much value in a secondary market. So, instead of a temporary deviation from the trend we have a permanent deviation from the trend.
If we are in the “unit root” scenario what does that mean? It means that a deviation from the growth trend is largely permanent barring a future deviation that moves back to or above the previous growth trend. What evidence is there supports the unit root hypothesis? Well here is the graph of GDP that extends trend prior to the recession and financial crisis.
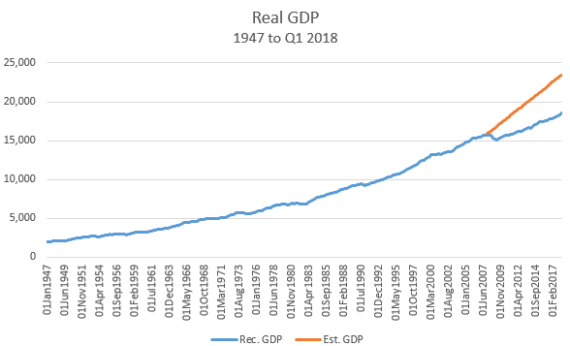
As can be seen the pre-crisis trend would have resulted in considerably higher GDP than we currently have. Current GDP as of Q1 2018 is $18,515 billion. If the trend above had continued GDP would have been $23,490 billion. Of course, estimating these kinds of models is as much “art” as it is science. For example the above has an auto-regressive error term. This error term does seem to raising the GDP growth more than with a simple trend model. In this case, GDP would have been $21,699, and the graph in this case looks like,
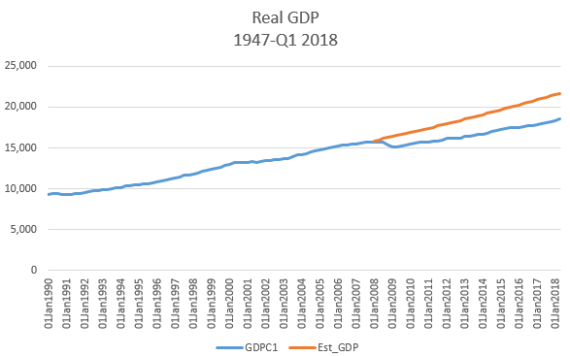
In either case what we see is a growing divergence between recorded GDP and the trend stationary GDP estimates. That is, the argument that the financial crisis/Great Recession is not a unit root event is not looking good. There is no indication of a return to original trend. Additionally, using SAS and the proc ARIMA procedure I ran an augmented Dickey-Fuller test and the results indicated rejecting the null hypothesis of no unit root–i.e. that the correct model is one with a unit root. It seems reasonable to conclude that those who suggested the possibility of a unit root were indeed correct and that their detractors were wrong. I guess “evil” wins.
Nice piece, Steve.
How do you analyze/model for the policies extant post crisis? Specifically, if you had growth retardant policies post crisis but return to pro-growth policies you could have return to long term trend.
My own view is that bubbles operate under rules unique to themselves and what happened in 2008 was the collapse of a bubble. Not every recession results from the collapse of a speculative bubble.
What happened in the Netherlands in 1637? Assets that had been worth substantial amounts suddenly collapsed in value and not just those assets themselves but the ancillary assets that were used to produce those assets. That had major effects on the Dutch economy for years. Who happened to all of that value? It just disappeared. That’s how speculative bubbles operate.
When the values of houses declined suddenly in 2007-2008, ordinary fiscal pump-priming was not an efficient response because the value was just gone. That’s different from the situation Keynes was responding to in the 1930s when there was still unused productive capacity across a broad section of the economy.
@MBunge: Is there anything in the world you won’t use to blame someone else for your vote for Trump?
Interesting and timely, but I will be looking for a calculus teacher to interpret some of this for me.
That value was destroyed by the home price collapse certainly seems true. But let’s try to think this through.
If you had a wealth effect and artificially high economic activity associated with home building as the bubble grew, it would have either inflated GDP trend beyond sustainability, or diverted GDP from other endeavors. In the former the pre-crash slope might be too high, and the extrapolation also too high. Value destruction would just get us back to where we should be and the red and blue lines on top of each other. In the latter, it’s just the composition of GDP being “housing heavy.” And whatever suboptimal effects you wish to ascribe to that.
I’ve been driving all day and am tired so that’s all I’ve got, except to note that things go both ways. In housing markets I’m familiar with (S Florida, Scottsdale AZ and Asheville NC) I can tell you home prices and activity are all the way back. Maybe more. That would recreate the destroyed value.
I’d say both.
@Dave Schuler: I don’t disagree. But it is still a unit root problem. That Krugman and DeLong could not or would not see this is on them. They were wildly wrong. Good thing nobody listened to Krugman and go for $1.5 trillion or larger fiscal stimulus that almost surely would not have worked.
I am probably showing my ignorance, but it strikes me that your graphs have only two curves with the red line being an extrapolation of the trends leading up to the divergence point. Is it correct to continue the trend line in this manner? The years prior to the decline incorporate the “boom” times that characterize the bubble and make it inherently unsustainable. Perhaps one could generate a green line from 1995 to 2015 with the 1995-2008 blue line above representing the bubble and the 2008-2015 portion as the crash.
I know that Bernanke was a student of the Great Depression and feared a replay. I don’t know why AIG was rescued but Lehman and Behr Stearns were allowed to crash. The government supported GM; right or wrong?
@Slugger:
That is the question. Those who favored the “unit root hypothesis”–e.g. Arnold Kling, Greg Mankiw, myself, etc. said “No.” Those who thought the unit root hypothesis was “evil”–e.g. Krguman, DeLong, et. al. thought “Yes (we could return to that trend).” Clearly those who favored the unit root hypothesis were correct. Nearly 10 years on since the start of the Great Recession there is absolutely no indication that the new trend will intersect with the previous trend.
You are up too early, Steve.
The unit root view certainly seems born out by this dataset. But I return to my original query. How does one deal with policy? As a control investor in manufacturing companies I can tell you unequivocally that Obama era policies caused small to medium sized companies to adopt a very conservative posture. Diminishment of expected returns and increase in risk had an effect. There was no hope of return to trend, unit roots or not.
I’d say it’s too early to say definitively what the outcome will be, but I can also tell you that everything from animal spirits to hard nosed risk/return assessment is positive right now. We could return to trend.
That doesn’t mean that the housing crash wasn’t a unit root phenomenon, but doesn’t it argue that after a “negative innovation” all efforts should be made to adopt policies that turn the GDP slope upwards? (And my policies wouldn’t be Krugman or Obama’s, they would be get the hell out of the way).
Seconding and thirding the above comments. The GOP (and right-wing Democrats) very deliberately pushed contractionary policies, and are still doing so.
Not fully following the math so forgive me if I am missing something but I don’t see any attempt to control for other factors before declaring victory and taking a lap. Am I missing something?
@Steve Verdon: “Good thing nobody listened to Krugman and go for $1.5 trillion or larger fiscal stimulus that almost surely would not have worked.”
Wow,. Just – Wow.
@SKI:
Right?
There was a fvck lot more to the Bush Collapse than housing…and the aftermath was heavily tainted by politics.
Basically though, anything Drew agrees with is automatically suspect.
@Daryl and his brother Darryl:
Now there’s some well reasoned analysis……….
If you’re still listening, Steve, what’s going on right now? If fiscal stimulus is producing economic growth doesn’t it either mean that we’re time-shifting growth or that there’s actually some potential product left in the economy?