Age More Important than Race: WaPo-ABC Poll
WaPo fronts a new poll they’ve commissioned in partnership with ABC News under the headline “3 in 10 Americans Admit to Race Bias Survey Shows Age, Too, May Affect Election Views.”
While it’s somewhat surprising that nearly a third of Americans admit to “at least some feelings of racial prejudice” (30 percent of whites, 34 percent of blacks, and 27 percent of “Others”), the offsets are more interesting. Let’s look inside the poll itself.
- Nearly double the number of people (40 percent) said that age was important as compared to race (23 percent), although those saying it was very important were about the same (12 percent and 13 percent, respectively).
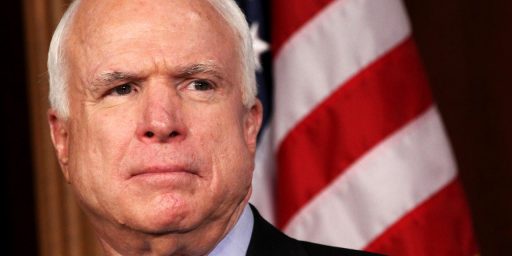
- Obama has better favorables (63 percent) than McCain (56 percent) and much higher strongly favorables (35 to 18 percent). And virtually no one has “no opinion” of either candidate.
Only two issues rate double digits as “the single most important issue in your choice for president:” Economy/Jobs (33 percent) and Iraq/War in Iraq (19 percent). The only other answers with significant response were Health care (8 percent), Gas/Oil prices/Energy (6 percent), and Terrorism/National security (4 percent). Obama gets higher “trust more” ratings than McCain on virtually every issue:
Obama also beats or ties McCain on the important values questions:
Ideologically, 52 percent think Obama is “just right” as compared to only 40 percent for McCain. The internals, though, are more interesting:
- 36 percent think Obama is “too liberal” compared to only 5 percent who say he’s “too conservative”
- 34 percent think McCain is “too conservative” but 19 percent say he’s “too liberal”!
So, despite whatever damage the prolonged primary battle may have done to Obama’s support among Democrats, McCain has much more mending to do with his natural base. Interestingly, McCain’s “too liberal” numbers are comparable to what they were in 2000. His “too conservative” numbers have doubled.
Otherwise:
- On the national security front, the results split as to which candidates they favored. 65 percent support withdrawal from Iraq and 61 percent disagreed with the idea that “non-citizens suspected of terrorism . . . should be allowed to challenge their detentions in the U.S. civilian court system.” [UPDATE: Commenter Houston points out that I’m omitting the non-standalone questions in my analysis here. Indeed, if we look at those surveyed under “issues,” national security is stronger for McCain. McCain leads 49-43 on “international affairs,” 47-46 on “War in Iraq,” and 53 to 39 on terrorism. The second of those is particularly odd given that 65 percent want us out of Iraq, which is much closer to Obama’s position than McCain’s.]
- And people value “New direct and new ideas” more highly than “Strength and experience” by a 50 to 43 margin.
- The only hopeful sign for McCain, seemingly contradicting some of the above findings, is that more people (56 to 52 percent) think he is a “safe choice for president” and slightly more people (46 to 42 percent) think Obama is a “risky choice for president. At roughly the same time in 2000, 59 percent thought George W. Bush was safe and 38 percent thought he was risky compared to 57 percent and 40 percent for Al Gore.
Also of interest:
- Slightly more (72 percent) of Obama’s voters say they will definitely vote for him as compared to 69 percent of McCain’s.
- Only 50 percent think Obama has “the kind of experience it takes to serve effectively as president.” (The question was apparently not asked about McCain.) Yet, 43 percent lean toward Obama compared to only 42 percent for McCain.
- 57 percent though McCain would “mainly continue in George W. Bush’s direction” vice 38 percent who thought he’d “mainly lead the country in a new direction.”
- 77 percent think a president “SHOULD be willing to meet with leaders of foreign countries that are hostile toward the United States because talking can improve relations and avoid confrontation.”
- 39 percent of Democrat leaners want to see Hillary Clinton get the nomination. Yet 75 percent are satisfied or enthusiastic about the outcome.
- 46 percent would like to see Hillary Clinton as Obama’s running mate. John Edwards, with 8 percent, is the only other candidate getting meaningful support.
- 50 percent favor “smaller government with fewer services” compared to 45 percent who favor “larger government with more services”
- Only 19 percent consider themselves to be “a feminist,” compared to 77 percent who did not
- 43 percent rate themselves as Moderates, 33 percent as Conservative, and only 21 percent as Liberal
The sample group seems to be somewhat skewed:
- 27 percent were aged 50-64 and another 16 percent 65+
- 54 percent had at least some college, with 11 percent having post-graduate degrees
- 18 percent made less than $20,000 a year
I’m skeptical of some of the other numbers, as well. For example, 75 percent claim to be following the election closely, with 34 percent saying they’re following “closely.” This roughly mirrors the numbers from this point in 2004 (78 percent) and is up a quarter from this point in 2000 (49 percent). 71 percent say they’re certain to vote and 81 percent claim they’re registered to vote at their present address. These answers simply don’t reflect reality. In 2004, which had the highest turnout in a generation, only 60.7 percent of eligible voters showed up. And this is a survey of “adults,” not registered, let alone likely, voters.
These answers — and perhaps those to the race questions, as well — are quite probably skewed by people telling pollsters what they think they’re expected to say rather than the truth. Indeed, the fact that nearly a third of respondents were willing to admit some racial prejudice (admittedly, after a strong of questions where they could demonstrate that they had friends of other colors and so forth) is surprising.

Two quick comments: How can you say “On the national security front, the results split…†Look at the numbers you quote on “international affairs,” “the war in Iraq” and “the war on terrorism.” They seem pretty strong to McCain to me.
Secondly, you say the numbers “are quite probably skewed by people telling pollsters what they think they’re expected to say rather than the truth.” Well, duh. I wonder what are the political affiliations of the responders…
A fair point. I was looking at the standalone questions, not the issue clusters.
You don’t need to wonder, the poll tells you.
“Generally speaking, do you usually think of yourself as:
Democrat 38
Republican 24
Independent 34
“Do you lean more towards the:”
Democratic Party 43
Republican Party 37
Neither 19
I think those numbers for racial bias are too high, in this day an age. At the start of the campaign less than 1 in 10 said the would not vote for a woman or a minority, which is an imperfect proxy for race.
James doesn’t the racial prejudice answer cut against your assumption that people are telling the pollsters what they want to hear?
More generally, “people tell the pollsters what they think they want the pollsters to hear” seems like a pretty durable truism. But what backs it up? What did the late polls in 1980 and 1984 look like, frex? (A genuine question for the guy with closer ties to the polling community than me.)
Jim, A fair question.
As I noted in a post yesterday, recent evidence seems to suggest that the so-called “Wilder effect” or “Bradley effect,” where the poll numbers for black candidates is substantially overstated in comparison to the eventual vote, seems to be dissipating.
I don’t have the older poll numbers handy but the “definitely vote” numbers are way, way higher than in previous cycles. the ABC/WaPo numbers for 6/11/2000 showed 49 percent saying they’d definitely vote and 36 percent on 7/17/95 (which isn’t directly comparable, obviously, since it’s a year earlier in the cycle).
In the case of voting turnout and “following closely,” it may just be a conventional wisdom thing. Still, I’m rather sure that, despite almost everyone surveyed claiming that they’re paying close attention right now we’d find that the vast majority of people don’t know where the candidates stand even at a high level on their signature issues. And, while I expect 2004’s high turnout to be replicated or even exceeded, I don’t think we’ll see 71 percent of eligible adults showing up. Or, indeed, 71 percent of registered voters.
My guess is that the admission of racial prejudice figures were so high because of question ordering. It came after a series of other questions on the subject which allowed people to get more comfortable. They were able to say that they though race relations were a big problem, that they themselves had good friends of other races, and so forth before being asked, essentially, “C’mon, admit it, you have racially insensitive thoughts every now and again even though you’re not really an evil racist, right?”
Thanks, James. I think your last paragraph is probably correct. The heck of it is, it’s the truth, isn’t it? We pretty much all HAVE racially insensitive thoughts.
Of course, the heck of it is, approached that way, a one-third yes rate looks really low. On one level, this suggests that TWO THIRDS of respondents are denying a universally true fact because they think the pollsters want No answers. On the other hand, we have no reason to believe the respondents are trying to fool the pollsters – they could just be fooling themselves.
But it’s just a bad question, isn’t it? Because the meaning is open to personal interpretation, it’s really a bunch of questions and you have no way of knowing which one any given respondent decided to answer.
Exactly so.
I suspect, incidentally, that the same is true of the much more direct “Are you a feminist” question. I’d probably say No, given the baggage the term has. But I’d say Yes to questions about whether women should get equal pay for truly equal work and so forth.
I don’t think we usually see Scots-Irish candidates campaigning for that block nor do people usually vote for a candidate based on considerations of his race or religion. But if we examine the voting patterns I think we do see some tribal loyalties emerge. Unfortunately for the dhimmies running a pattern using questionable assumptions and engaging in stereo typing of people you do not identify with isn’t a very good way to win people outside of Berkley and Amherst. This election looks more like a repeat of 1972 each day. An unpopular Republican beats the tar out of far out radical.
Even Obama’s slogans and campaign slogans bear an uncanny resemblance to McGovern’s pledges of a new course and change.