Is ‘Electability’ Measurable?
A WaPo data analyst gives it a shot.
WaPo data analyst David Bylar claims “Want to know which Democrats can actually beat Trump? We don’t have to guess.” His column defies excerpts. Suffice it to say, it begins with this proposition:
[I]f a candidate did well in major down-ballot elections compared to an appropriate baseline, they’re doing something right and might perform strongly in a general election.
And uses this graphic as a jumping off point:
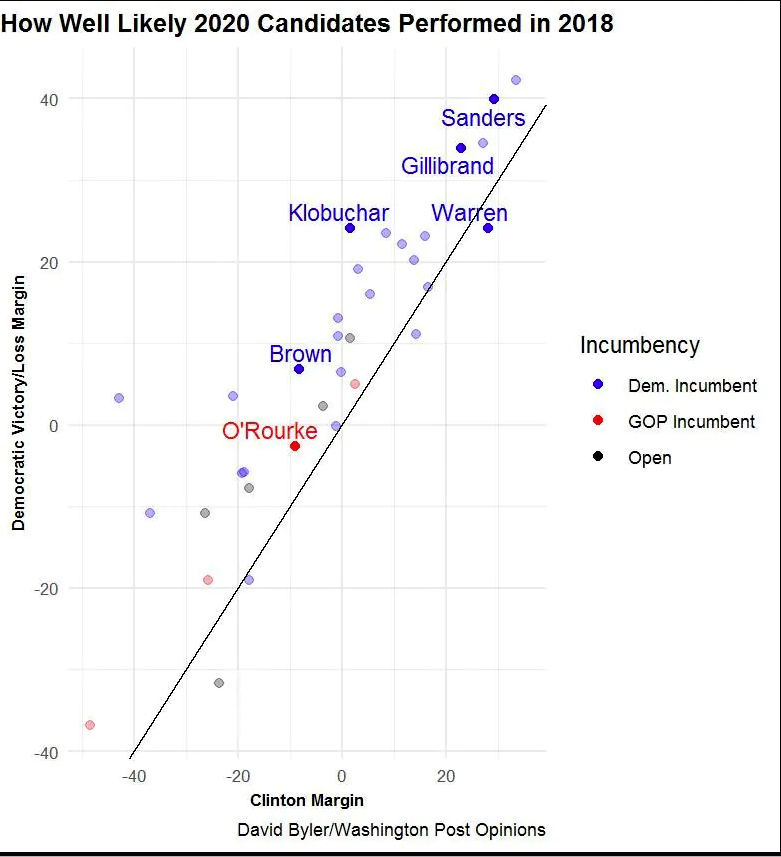
In fairness, this is the first of an intended series of columns. Byers concedes that there are “different aspects of electability” and that these include “past election results, demographics, ideology and style.”
In terms of this specific column, though, it’s not obvious that one gains much by comparing a series of idiosyncratic races. So, for example, we have this:
Sen. Amy Klobuchar (Minn.) is the obvious queen of this graphic. Clinton won Minnesota by a margin of 1.5 points in 2016, and Klobuchar won the state in 2018 by 24.1 points. Klobuchar had some advantages over Clinton: Public opinion was much better for Democrats in 2018 than 2016, and incumbent senators do get a boost. But it’s impossible to explain that gap away without attributing some real electability to her.
I have no real opinion of Klobuchar, of whom I’m not sure I’d heard until her confrontation with Brett Kavanaugh during the latter’s Supreme Court confirmation hearing. She seems impressive enough. But I’m not sure what we can glean from a huge margin in a race against a sacrificial lamb. Jim Newberger was a backbench state senator whos only claim to fame seems to be getting repeatedly reprimanded for boneheadedness.
Similarly:
Former congressman Beto O’Rourke also looks pretty good in this graphic despite having a lot of stylistic differences with Klobuchar. He didn’t outperform Clinton by as much as Klobuchar (Clinton lost Texas by nine points, O’Rourke lost by less than three), but he was running against Republican incumbent Ted Cruz. If you give Cruz something like a five-point bonus for being a sitting senator (incumbents tend to outperform non-incumbents, though calculating the incumbency bonus is tricky — they change over time and can be calculated more than one way), then O’Rourke’s performance starts to look much more impressive.
O’Rourke seems genuinely charismatic and likable compared to Hillary Clinton. But she was running against Donald Trump in a presidential election year while he was running against Ted Cruz in an off year. I happen to think O’Rourke would fare well against Clinton in a Texas Democratic primary, presuming the outcome wasn’t sufficiently baked as to encourage strategic voting. But that has as much to do with ideology as likability.
In 2012 (a year not shown in the graphic), Brown won reelection by six points, while President Barack Obama won the state by three. That’s not a huge gap — if you give Brown a normal incumbency bonus, you can explain the gap without attributing any extra electability to Brown.
Brown obviously outperformed Clinton by a lot more in 2018 — he won by almost seven points in a state where she lost by eight in 2016. But if you again give Brown an incumbency bonus and account for the big swing in overall public opinion (the GOP won the House popular vote by a point in 2016 and lost it by about nine in 2018), you can explain a significant amount of this gap. Moreover, if you were to use 2012 and 2016 results as the baseline, Brown would look worse, because Obama performed much better in Ohio than Clinton did.
That’s not to say that Brown does badly on this graphic. He’s a solid politician, and I firmly believe he would be president if he had been nominated in 2016. But on this scale, he doesn’t do quite as well as Klobuchar, and some of his competitors are closer to him here than they might be in other categories.
This is probably a more useful comparison that either Klobuchar or O’Rourke, in that Ohio is a swing state whereas neither Minnesota nor Texas are. But, here, Bylar is changing his own rules for no apparent reason. Klobuchar is given full credit for her increased margin over Clinton but Brown’s is discounted because of anti-Trump sentiment that resulted in a wave election in House contests. Why?
Sen. Kirsten Gillibrand (N.Y.), for example, won her 2018 race by 34 points after Clinton won her state by 22.5 points. That’s not as good as Brown, but electability is a sliding scale with fuzzy categories, so we should think in those terms and not simply categorize Brown as “electable” and Gillibrand as “not.”
Again, I’m persuadable that factors other than “electability” are at work in a Gillibrand-Brown comparison. But Bylar established the rules of the contest and seems to have abandoned them after the first two candidates.
Sen. Bernie Sanders (Vt.) is a funkier case. He won his 2018 race by 40 points after Clinton won Vermont in 2016 by 26 points. But we should hold off on the “Bernie would have won!” chants — we’re going to have a lot more to say on him in subsequent pieces on ideology and demographics.
This is not “data analysis” in any sense whatsoever.
The only candidate who objectively performs poorly is Sen. Elizabeth Warren (Mass.), who somehow managed to underperform Clinton despite 2018 being a much better year for Democrats than 2016. Massachusetts is a politically complicated state, electing a parade of Republican governors and Democratic senators, but it’s hard to look at this performance (or some of the other indicators) and spin it as a great sign.
I tend to agree. Then again, I took Warren’s re-election as a fait accompli and didn’t pay much attention to the race. Still, while Geoff Diehl was obviously a sacrificial lamb, one presumes he’s more appealing to Massachusetts voters than Donald Trump.
Biden is arguably a trickier case. Everyone in the political world feels like they know Biden since he was vice president for eight years, but it has been a decade since he has been on the ballot as an individual. So we don’t really know if post-vice-presidency Biden would have a different sort of appeal than pre-vice-presidency Biden. Being vice president obviously improved his primary performance — he’s leading in the polls now after flopping in the 1988 and 2008 primaries for president. But the general election is a different animal, and we’ll have to tackle him in more detail in future posts.
Fair enough. Biden’s “have a beer with” factor is high but we don’t have election data for the purpose of this comparison.
Overall, while I applaud Bylar for trying to get beyond fuzzy platitudes and apply data to the question of “electability,” I don’t believe the particular comparisons made here provide much useful information. Maybe his future articles in the series will reveal some way to meld the election data with analysis about ideology, demographics, and style in a way that’s more objective. But I’m skeptical that past performance in specific local races tell us all that much about future national (or, nationally-aggregated local) elections.
Richard Nixon is the last person to win the presidency after having lost a statewide (California governor) race. He’s also the last person to win the presidency after having previously lost the race as a major-party nominee. But our electoral process has changed so much since 1960 as to make that example virtually meaningless.
Most recently, Donald Trump won the presidency (if not the national popular vote) after never having been subjected to a previous electoral test.
In between, it’s not obvious that Barack Obama’s performance in his successful bid for a US Senate seat from Illinois vis-a-vis John McCain’s re-election to a US Senate seat from Arizona or Mitt Romney’s for the Massachusetts governorship told us much about their respective races. Ditto George W. Bush’s re-election as Texas governor vice John Kerry’s for Senate in Massachusetts.
tl;dr: Graph!! Graph with Bernie at the top! Commander-in-Chief Sanders….(faints)
QFT.
I raised an eyebrow over that article as well. Let’s wait until, say, another six or eight months before we decide who can or cannot be elected.
I think that’s the essence of the problem.
While we have electoral data for over a century, the conditions, norms, mores, ideologies, etc. which influence results keep changing. Maybe the sample size for each set of unique circumstances is too small to draw out the underlying trends.
You make valid points. I’m not sure the results in state contests provide for a good comparison with presidential races, even ones that happen the same year. There are too many factors to account for. You nailed the problem with your statement, “while Geoff Diehl was obviously a sacrificial lamb, one presumes he’s more appealing to Massachusetts voters than Donald Trump.”
That said, I’ll at least give Bylar credit for attempting to quantify the concept of “electability.” It’s one of those terms lazy pundits like to throw around without ever defining precisely. When Howard Dean collapsed in the 2004 primaries and John Kerry emerged as the favorite for the nomination, I remember hearing the e-word being bandied about quite a lot.
And of course, probably no candidate in history was called “unelectable” more than Donald Trump.
There are several problems with the concept of electability. It’s usually described in a binary way: either you’re electable or you aren’t, and if you aren’t, that means you can’t possibly be elected. The problem is that the effect of a candidate’s strengths and weaknesses is relative and not absolute; it’s dependent on who the other candidate is and on the surrounding circumstances. It’s conventional to describe Barry Goldwater and George McGovern as having been “unelectable” because they lost in massive landslides that were in part blamed on their perceived extremism, but both were running against popular sitting presidents. What if they’d been running against a president like Carter 1980 or Bush 2008? Indeed, that’s scarcely hypothetical, for in 1980 a Goldwater Republican did run and win, at a time when many people felt he was too right-wing to be “electable.”
The people most attached to the concept of electability seem to be centrists with a preference for candidates they regard as “safe.” These people have helped shape the narratives that have entered the history books: particularly the story of Bill Clinton’s rise, which is invariably attributed to Clinton’s centrism rather than to, say, the fact that the incumbent president he defeated was dealing with a recession.
“Electability” masquerades as an attempt to evaluate a candidate’s strengths in a neutral way, but in practice people read into it what they want to believe about the public. Right-wingers like to imagine they’re a “silent majority” and that the GOP’s mistake is when they nominate “RINOs.” Hardcore lefties point to “corporate Dems” as the culprit in election losses. Meanwhile, the Beltway set talk about the need for reasonable centrism that rejects the extremes of the two parties–invariably leading to praise for deficit hawkery that there’s absolutely zero evidence holds widespread public appeal.
My advice: It’s fine to discuss a candidate’s potential strengths and weaknesses, both in their policy positions and their personality. But “electability” is usually an attempt by people to make their own preferences sound more objectively important than they actually are.
Trump won the 2016 Mass. primary with 49.3% of the vote, which I think was his largest primary win in any state. Jeb Bush got 1% of the vote. Of course, the number of registered Republicans in Mass. is about a third of those registered as Democrats. A plurality are Independents.
@CSK:
No. He won an absolute majority in New York and every state after–though that was pretty late in the primaries after he had only two remaining rivals and they were both mathematically eliminated from winning the nomination without a contested convention. MA was his best state before his late streak.
@Kylopod:
Ah, okay. It struck me as odd, though, given how relatively liberal most Mass. Repubs are, certainly in comparison to southern and midwestern ones. Kasich, the next runner-up, only got 18&.
@CSK:
Everything about Trump’s rise was odd, but it’s worth noting that his best region in the primaries was the Northeast. Part of that, as mentioned, is that most of the NE states voted late, when he already had more or less sealed the nomination unless there was a contested convention. But I think part of it is that he filled the niche of the “secular” Republican better than the others. He came to his anti-abortion stance fairly late, and most people took it to be opportunistic rather than sincere, just like with Romney. It certainly wasn’t something he focused on. (Kasich in contrast has a much stronger and more convincing anti-abortion record.) His campaign was also strikingly free of LGBT-baiting, and he even came out against restricting bathrooms. These are among the reasons why I believe he did better in NH than Iowa, and well in the Northeast as a whole.
@Kylopod:
The 1992 election is full of confounding factors and variables, to the point where it’s hard to say what happened:
1) Bush the elder was so popular after the Gulf War, that many prominent democrats decided not to seek the nomination.
2) The Ross Perot factor, which has confounders of its own.
3) The, in hindsight, mild recession hit right in the electoral season.
4) The challenge for the nomination on Bush’s right flank.
5) The Jennifer Flowers kerfuffle, and how Clinton escaped from it more or less whole.
And plenty more, like the Whitewater rumors, the Hillary Rodham Clinton thing (which seems so antiquated today, yet she ran under her married name afterwards), lingering effects from Iran-Contra, lingering effects from the collapse of the Soviet Block, etc.
If the rest of the country was just like Vermont, and Bernie Sanders opponent in his last election was identical to Donald Trump, and the economy did not change at all, then yes, Bernie Sanders would be the most electable, and this chart may or may not prove that.
No, no, it’s Klobuchar. Its a bady designed chart.
@Kylopod: I disagree that Goldwater and McGovern were running against popular Presidents, although you could say Goldwater was running against the memory of JFK. Both Johnson and Nixon weren’t particularly popular so much as Goldwater and McGovern were unpopular, or advocated unpopular positions which their opposition used to their disadvantage.
@SC_Birdflyte: LBJ’s Gallup approval rating never went below 69% at any point in 1963-4. Nixon’s 1972 ratings weren’t quite as astronomical, but they were hovering around the high 50s, low 60s all year.
So yes, I’d say they both were very popular.
@Kathy: I was going to post something similar. There’s just not enough quality data to be doing this sort of analysis.