Mind-Blowing Maps
Trending on Twitter this morning is a collection of infographics compiled by Ezra Klein under the heading "22 maps and charts that will surprise you."
Trending on Twitter this morning is a collection of infographics compiled by Ezra Klein under the heading “22 maps and charts that will surprise you.”
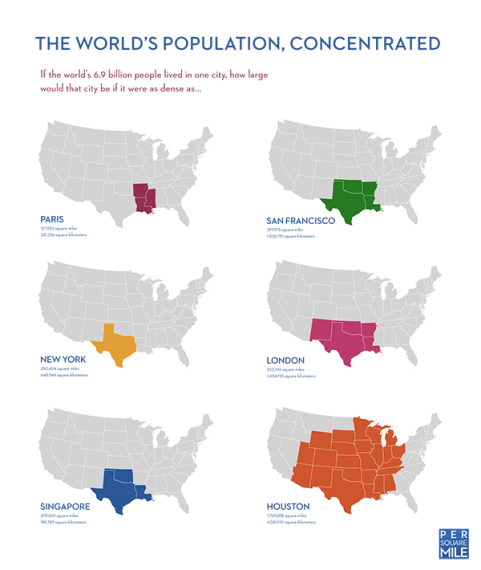
The one making the rounds is number 18, “If the world was as tightly packed as New York City, everyone could fit into Texas.”
This fascinating infographic from Per Square Mile shows that if everyone in the world lived as close together as, say, New Yorkers, they could all fit into Texas. Which is all to say that we’ve got a lot more land than we have people. But there’s an important caveat: it takes a lot of land to support all those people. As Per Square Mile goes on to note, if everyone in the world required as much land to support them as Americans do, we would need four earths.
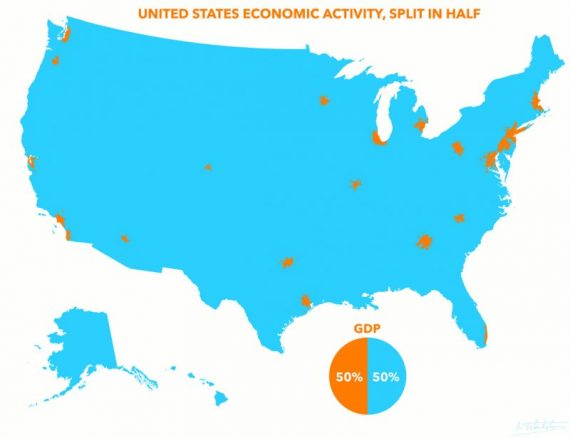
That’s pretty impressive. Perhaps more interesting is #15, “Half of US GDP comes from these 23 orange blotches.”
Half of America’s gross domestic product comes from the 23 orange blotches on this map. The other half comes from the vast acres of blue. Those orange blotches are America’s largest metro areas — and they absolutely power the American economy. But though small in size, they’re large in population: about 110 million people live in those orange blotches, says Reddit user Atrubetskoy, who created the map. So what you’re seeing on this map isn’t just that there’s a lot of economic activity compressed into some very small spaces in America, but that there are huge swaths of the American landscape where not that many people live.
While I’ve seen something like it before, #3, “Africa is much bigger than you think,” is also pretty impressive.
Most maps you see are based on the “Mercator projection,” so named for Gerardus Mercator, who came up with it in 1559. The Mercator projection is excellent for sailing, as it shows constant bearing as a straight line. But it’s terrible for estimating the size of large masses of land — particularly when they’re close to poles. Under the Mercator projection, for instance, Africa looks to be about the same size as Greenland; it’s actually 14 times larger. The Economist — building on work by Kai Krause — made this graphic showing Africa’s true size: bigger not just than Greenland, but than China, the United States, India and Western Europe put together.
The whole collection is worth a look.


I would guess that most of the contribution to GDP in the PDX metro area is the result of Intel.
The total blueness of North Dakota, which is having a huge oil boom, has me questioning that GDP map.
Maybe the oil revenues are credited to the companies’ headquarters, and not the oil fields?
The Detroit blob looks pretty big; I thought Detroit was in decline.
If the Earth’s population stood closely packed, would we all fit on Zanzibar?
Do the blobs that have half of America’s economic activity have half of the votes in the representative instrumentalities of government? If not this might be a cause of friction.
I’m reconsidering my “HQ” theory. There’s no blob in Arkansas for Wal-Mart, and I think they would count.
So I’m back to slightly puzzled…
@Jenos Idanian #13: Considering that Wal Mart produces nothing, I am not surprised.
@OzarkHillbilly: Damn, that’s a good point. I brain-farted on “sales” not really being part of GDP. Thanks for the correction.
So I’m back to my original theory that the numbers are based on corporate headquarters. That would explain Detroit — the automakers have their bases there, even though the city itself is in the toilet.
I briefly considered corporate incorporations, but if that was the case, Delaware would be #1.
You wanna see some mind blowing maps? Check out these.
@OzarkHillbilly: Interesting. I note the “CO2 emissions changes, 1990-2008” shows the US at “less than 10%,” meaning positive, but slightly. And a HUGE swath of “100%-1000%” nations.
In return, I offer this map. Note how many of those involve Islam — often on both sides.
@Jenos Idanian #13:
North Dakota has a drilling boom, not really an oil boom. And it’s totally unsustainable.
I’m guessing the orange blob in NC is Charlotte, Bank of America HQ. I thought Research Triangle Park would’ve shown up.
The West Wing did a funny bit about the map situation worth a view:
https://www.youtube.com/watch?v=vVX-PrBRtTY