Weak Economic Recoveries Are A Feature, Not A Bug
Business Insider’s Steven Perlberg passing along this chart from a new paper on American employment by economists Olivier Coibion, Yuriy Gorodnichenko and Dmitri Koustas who analyzed recessions and recoveries going back more than 20 years and found that “weak” recoveries have increasingly become the rule rather than the exception:
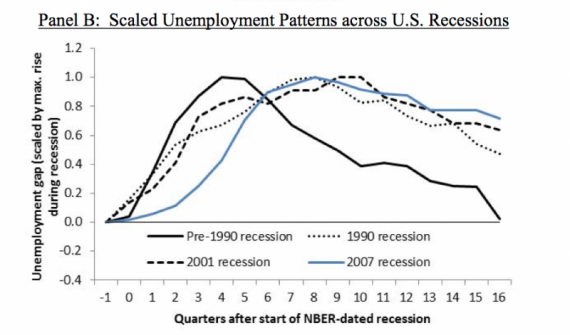
Summary:
The trend is reminiscent of 1980s Western European recessions dubbed “Eurosclerosis,” leading the authors to ask if the United States is fighting its own bout of “Amerisclerosis.” In lay terms, we might call Amerisclerosis the “jobless recovery.”
New normal indeed.
The link between these recoveries and;
a). the Republican war on the Middle-Class that started under Lord Reagan
b). the resultant rising-to-record-heights inequality
is simply undeniable.
You just cannot have this graph…
http://scotterb.files.wordpress.com/2010/12/gap-between-rich-and-poor.jpg?w=620
and expect the graph above to look any different.
There is no mystery about how to end a recession and restore employment. Keynes figured it out 70 plus years ago. It still works. But the 0.1% view the necessary deficit spending and the presumed (not necessarily correctly) subsequent inflation and taxes as a direct threat. As post WWII America becomes increasingly oligopolistic, it becomes harder and harder politically to do the right things.
And before we get a round of, ‘Deficit huge, Obama bad’:
– the deficit is falling at a rate that scares economists
– were government employment at normal levels, unemployment would be down to normal levels
– just a day or two ago Bernanke was once again begging Congress for some fiscal stimulus
– yes we did a stim package, a half arsed package, and we got half arsed results
So, yes…indeed…weak recoveries are a feature of radical Republican economic theories.
Why’d they only go back 20 years?
@Tillman: “Why’d they only go back 20 years?” To exclude the rip roaring Reagan recovery that’s why. We’ve had big government statists, Republican and Democrats, who don’t understand the economy, in the Oval Office ever since. Obama has been the worst, and ironically Clinton — after losing the healthcare standoff — was the best of a pretty lousy bunch.
@Tillman: They went back farther than 20 years. “Pre-1990 recessions” is the average of previous recessions. I looked through the article and couldn’t find how far back they went, but typically studies like this go back to at least WWII.
This is not a surprise to anyone who understands what happened during the 2008 crash of the housing and financial markets. The Federal Reserve currently says that in the 4 years since the crash of our economy we have recovered only 45% of the $16 trillion in wealth and income assets lost. That $16 trillion represented over 20% of total wealth.
An anemic recovery is not a surprise. I only hope that those who advocate policies of economic austerity do not prevail, or we will be talking about real economic decline, and not about weak recoveries.
@Let’s Be Free: “They” are not trying to exclude anything. If you’ll notice, the graph goes forward 4 years from the start of the recession, to where the pre-1990 recession returns to pre-recession unemployment. That tells you very little about the boom after a recession, what we typically call a “recovery”.
“…To exclude the rip roaring Reagan recovery that’s why…”
Of course that rip roaring recovery included exploding the debt, the size of government, and raising taxes. It didn’t hurt that the cost of oil dropped because Carter de-regulated it, and he appointed Volker.
Today taxes are at historic lows, we are shrinking government, and the deficit is shrinking faster than at any time since Eisenhower.
Those are the facts that Republicans today, including Let’s Be Free, chose to ignore.
This is effect is well established in our go-to chart, the long term jobs recovery graphic from Calculated Risk.
And of course this pattern has been discussed for years.
10 Real and Bogus Reasons for the Slow Recovery
You can note too that the slope of the graphs…both Doug’s and john personna’s…are essentially parallel. The issue with the Bush Contraction is that it was so friggin’ deep…thus the period of recovery is necessarily longer. Add in shrinking the Public Sector and the effect is compounded.
@C. Clavin:
No, not historically.
@ Pinky…
What are you talkin’ about Willis???
It’s the deepest since the Great Depression…or WW2…see the graph linked to by john personna, above.
If you have other information…link away.
@C. Clavin: Based on John’s chart, the 1948 and 1957 were just as deep a year in, and the 1953 was comparable. All three of those were back at zero within another year. So it’s hard to argue that the deepness of this one made it longer.
@Pinky:
No, it’s not hard to argue that at all. The collapse of the housing and financial markets vaporized over 20% of the wealth of this country – $16 Trillion, and as I noted above, the Fed is reporting that we’ve recovered only 45% of that wealth in the 4+ years since the crash. So yes, it is quite easy to understand why this economic recovery is weak.
@ Pinky…
I went to Public School…but it looks to me like the Bush Contraction went over a full percentage point deeper…6.2% vs. 5.1%…which is a 20%+/- difference to the negative.
Also 1948 was well before the ’80’s and the Republican Assault on the middle-class…which helped make the recovery longer.
@al-Ameda: You’re missing the point, I think. You can argue that this post-recession period has been longer and deeper than usual, but you can’t argue that it’s been longer because it’s been deeper. By analogy, you can argue that the Lions were bad because of their 0-16 season, but that doesn’t explain why they’ve been terrible forever. The degree of badness is high, no doubt, but the area under the curve is due to the length of badness as well as the severity.
@Pinky:
The CR chart I linked does show this as the deepest jobs loss since 1948. As al-Ameda says, that is either linked to or part of other losses.
But really, I think the CR chart by itself tells us much. This recession, as measured by jobs loss, was much worse, and yet recovered at the about same rate as the previous two. No wonder it felt bad.
(The unemployment “gap” seems a sketchier number because it is relative to a “notional” number, an imagined non-recession employment.)
@Pinky:
If you believe that the rate of recovery is related to structural issues, things that would be true for this recession as well as the next, then yes you can blame the length of the recovery on the depth.
The deep question is why we do have this pattern of lengthening recoveries.
I personally think that offshoring and automation have a huge role. Once manpower has been reduced, which would companies bring back, higher cost labor, or offshore work, or automation?
@john personna: I think you’re reading the unemployment “gap” in the first graph wrong. It appears to be indexed to height of unemployment = 1.0. And again, I’m not saying that the job loss wasn’t great – I’m saying that its persistence reflects something else. Unemployment was hitting new bottoms when previous recessions had been long over.
@Pinky:
If that’s true, it is certainly a way to hide depth as a factor!
@ john personna…
Did you see this?
http://www.slate.com/blogs/moneybox/2013/09/20/falling_labor_share_blame_trade.html
@C. Clavin:
I had not, but we have been defying common sense for some time. We say “where are the jobs?” even as we buy more and more stuff from China.
2+2?
@Pinky:
I’m arguing that it’s been long and deep because of what transpired in 2008. And that relates directly to the persistence of high unemployment and a lower level of labor market participation. A 20% loss in the wealth of Americans most certainly correlates to labor market weakness.
And, I do believe that it will be another 3 years before we’re in a period of sustained economic growth that exceeds 3% – that is of course, unless austerity advocates prevail in which case we could experience a lost decade, much as the Japanese did in the not-so-distant past.
Roughly 20-25 years ago was another oil shock, a war followed by the real economy quickly tanking, the S&L crimes, LTCM, loosened imports, auto industry near vaporization, and some other things that made investments in the business of moving money around a far more profitable use of capital than investment in stuff. The plus side was microelectronics.