Chart Of The Day: Truth About Taxes Edition
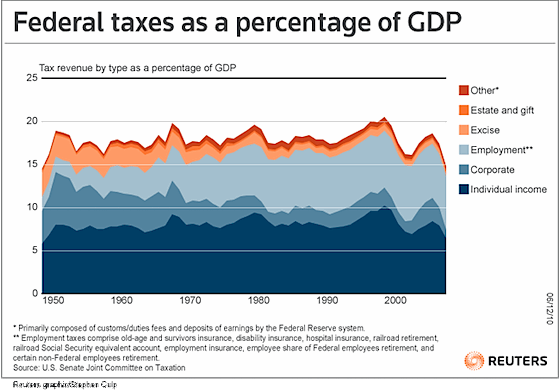
This chart from a Felix Salmon column in December is worth considering:
Salmon explains:
This chart should be ingrained in the mind of anybody who cares about fiscal policy. The main things to note:
- Federal taxes are the lowest in 60 years, which gives you a pretty good idea of why America’s long-term debt ratios are a big problem. If the taxes reverted to somewhere near their historical mean, the problem would be solved at a stroke.
- Income taxes, in particular, both personal and corporate, are low and falling. That trend is not sustainable.
- Employment taxes, by contrast—the regressive bit of the fiscal structure—are bearing a large and increasing share of the brunt. Any time that somebody starts complaining about how the poor don’t pay income tax, point them to this chart. Income taxes are just one part of the pie, and everybody with a job pays employment taxes.
One thing to note is that the share of estate taxes above reflects a period when the estate tax was zero. That ended on December 31, 2010.


Doug,
On the subject of taxes, if you don’t delineate between tax rates and tax revenue the article will move beyond nonsensical to deliberately misleading.
Another important thing to note – things the federal gov’t used to do but stopped are now being shouldered by states, which means that even as federal taxes have gone down, state & local taxes have gone up _except_ for corporations, who have just been getting a holiday in comparison to all the people who actually, you know, have to buy things. This makes our current overall tax structure far more regressive than it actually appears, and is another reason why the economy in general still sucks & will continue to do so.
And which, exactly, do you think this graph is showing?
Perhaps if we didn’t have nearly half the population paying no federal income tax the chart might look different. Perhaps if we didn’t have a tax code that encouraged businesses to keep incomes offshore the chart might look different. Perhaps if we clamped down on economic growth (reduce the denominator) the chart might look different.
Oddly, the Democrats are only in favor of the last option.
the chart is interesting. it does show that taxes are too low to be sustainable.
per bruce bartlett and jon chait – only once in history has the US gone 10 years without a recession…the bush 41/clinton expansion…and that followed two successive increases in the top tax rate. then as now the so-called conservatives predicted these increases would destroy economic growth. they were completely wrong then. gee – maybe they are wrong again?
it is important to keep in mind that those two revenue increases were also accompanied by spending cuts. the democrats are on board with a frothy mix of revenue increases and spending cuts. the so-called conservatives refuse to even consider revenue increases. they are only interested in cutting historically low taxes even more despite the fact that it will only add to the debt. therefore and ipso facto – they are fiscal fakes.
The amount paid as income tax as percent of GDP hasn’t changed all that much over time. Did you notice that? In the mean time, the amount paid in employment taxes (SS and Medicare) that everybody pays has grown from a small fraction of income taxes paid to at least equal to income taxes. This means that the “nearly half” of the population is paying more in taxes out of their paychecks than they used to.
Notice also that corporate tax revenues, which used to be a very significant part of total federal revenues, are now almost non-existent. In fact, the fall in corporate tax revenue seems to be mostly replaced by the rise in employment tax revenue. So no, it’s not odd at all that Democrats want to reverse that shift. What’s odd is that Republicans want to further it.
Sigh… Again with the funny maths…
Numbers curtesy of bea.gov; in 2010 the GDP wa 14.7 trillion, and the Federal tax revenue was 4 trillion. That works out to 27% not roughly 14%. Something doesn’t add up here.
I found this interesting:
What Really Matters for Growth (It’s Not Tax Rates)
Even if the data shatter one of my beliefs:
I had thought that the cumbersome nature of tax-favored accounts reduced their usage, and that a general exemption on interest and dividends would expand savings. BUT. If tax burden is a factor, then it should show some bonus even with current cumbersome systems.
That there is/was no increase in savings is both shocking and sad.
(catching up on general reading, off the edu topic for now)
Those numbers are wrong or mislabeled. Because, Federal spending has been under 4 trillion/year. So if Federal tax revenue is 4 trillion, the government should be running a surplus. But, it isn’t. Not. Even. Close.
Two more to complete the sad picture:
America’s lost trillions with an extremely sad but important chart.
Who’s Been Buying Treasuries? with a chart to fill the heart with fear.
(IIRC revenues are running about $2.5T … well, $2.2T)
John Persona–given that a root cause of the near financial collapse was the so called “savings glut” chasing better returns than the real economy could support, I’m not at all sure increasing savings should be a goal right now.
Again curtesy of bea.gov; Federal expenditures for 2010 were 5.3 trillion dollars. If you aren’t arguing with the correct numbers, it leaves your statements wanting…
Just to underscore the point in john personna’s second link above we’re financing our spending with fiat currency. We don’t need to worry about owing too much to China because the Chinese have stopped buying (and have sold a lot of what they bought earlier). The Fed is buying the overwhelming preponderance of Treasuries. I don’t see any way that can end well.
But gVOR08 it wasn’t our savings.
The savings glut in the developing world (strangely enough) financed too much credit among the affluent nations (again, strangely enough).
That really was a strange twist of economic history.
Right Dave, and the hanging question is how much yield it will take to bring them back.
China warns U.S. debt-default idea is “playing with fire”
Whether he is messing with us here might be an interesting question:
Mad Maths: actual link please? Your GDP number could be right, but your tax and spending numbers do not match any other report available, so maybe a little explanation of why those are accurate as opposed to everywhere else.
BTW, note that the turning point in household wealth was the Obama inauguration.
That may be a coincidence, but the data itself don’t seem to be too well understood in “are you better off” threads.
The numbers you posted appear to be combined Federal/state/local numbers (or close to it), not just those for the Federal government.
Federal-only revenues/expenditures for the past couple of years, from bea.gov
http://www.bea.gov/national/nipaweb/TableView.asp?SelectedTable=87&ViewSeries=NO&Java=no&Request3Place=N&3Place=N&FromView=YES&Freq=Year&FirstYear=2009&LastYear=2011&3Place=N&Update=Update&JavaBox=no#Mid
State/local revenues/expenditures for the past couple of years, from bea.gov:
http://www.bea.gov/national/nipaweb/TableView.asp?SelectedTable=88&ViewSeries=NO&Java=no&Request3Place=N&3Place=N&FromView=YES&Freq=Year&FirstYear=2009&LastYear=2011&3Place=N&Update=Update&JavaBox=no#Mid
GDP
Expenditures
I think I am right, just to make sure though, check the links in my previous post. I’m pretty sure those are the Fedreal numbers.
Ratufu posted links to the correct Federal numbers, yours may have included State/Local governments as well. (You want table 3.2 for Federal only, not 3.1)
Of Course, I would get the table wrong, foot meet mouth. However, when arguing for or against taxes I would still assert that total tax income would be important. If Federal taxes are decreasing but State and Local taxes are increasing due to the increased burden by reduced Federal aid, then the argument is still valid. Somehow I don’t believe that if Federal taxes increase that State and Local taxes will decrease. Can we sustain a total tax rate of 28% of GDP? Or higher as the author suggests.
Sure, a total tax rate of 28% is quite doable, in fact the first year I checked (1997) was 30%.
Assuming state local taxes are rising as federal taxes have been decreasing means the tax code is likely getting more regressive, especially considering the increase in employment taxes.
david m:
of course it is getting more regressive. that is the desired result of supply side economics. supposedly the rising tide would lift all boats. never happened. income inequality is the greatest since just before the depression. the solution proposed by the so-called republicans? make it worse even still.
I think it’s worth pointing out that those two bumps on the right hand side of the graph representing increases in revenues from personal income taxes each represent bubbles. Unless your economic strategy is to create yet another bubble I don’t see any particular reason we’ll see personal income tax revenues at the bubble levels for the foreseeable future.
That means we’ll continue to rely on FICA. Among the many reasons that’s the case is that FICA is a more broadly based tax than the personal income tax.
“Federal taxes are the lowest in 60 years, which gives you a pretty good idea of why America’s long-term debt ratios are a big problem. If the taxes reverted to somewhere near their historical mean, the problem would be solved at a stroke.”
This is comically untrue. While the recession has impacted tax revenues, it is hardly the primary, much less only, culprit. Historic federal revenues hardly ever exceed 18-20% of GDP, yet federal projections for spending are much higher than that. Obama is attempting now to lock in spending at 24%. So when tax revenues return to their norm (which they will do WITHOUT tax increases), how will that pay for what government is spending?
To put the absurdity of Salmon’s claim in better perspective, here’s another chart:
http://www.heritage.org/budgetchartbook/growth-federal-spending-revenue
Notice how, where revenues go down, spending also goes up. Not only that, spending went up even more than revenues went down.
One final chart:
http://www.heritage.org/budgetchartbook/entitlements-historical-tax-levels
I’d love to see how he thinks that problem will be “solved at a stroke”
Brian, isn’t this yet another attempt to paint the Great Recession as exogenous?
Emergencies have emergency spending. One wouldn’t extrapolate, say, hurricane expenses for the year of 2005, and assume they’d be e the same in 2006, 2007, 2008.
US Government Spending As Percent Of GDP turned in 2009, as the deepest part of the recession passed.