Many Of The 2014 Polls Were Wrong, Which Is Why We Should Be Skeptical Of Individual Polls
The results of the 2014 midterms should teach us some lessons about how to handle and evaluate polling.

In the final weeks of the 2012 Presidential campaign, Republicans desperate to find evidence that Mitt Romney’s fledgling campaign was doing better than the polling as indicating latched on to the analysis of an unknown blogger named Dean Chambers who claimed that all of the polling showing Romney losing the race was “skewed” to produce results that hurt Republicans. In addition to making that argument, Chambers used methods that he never really explained to “unskew” the polls and produce what he claimed were accurate numbers that showed Romney on the verge of a big win. At the time, many analysts, including Nate Silver, who at the time was still running his FiveThirtyEight blog at The New York Times, pushed back on Chambers analysis and “unksewing” methods to show why he was wrong. In the end, of course, the polling of the Obama-Romney match up proved to be mostly accurate, and the polls that did show Romney surging in late October proved to be outliers. Nonetheless, the “skewed polls” meme is one that continued to survive despite the fact that the actual outcome of the 2012 race suggested that the argument that the polls were deliberately biased held no water.
This year, though, there seem to have been plenty of examples of races where pollsters ended up being wildly off the mark when you compare their numbers to the results in given races. Some of the more prominent examples of this, of course, are the ones that grabbed headlines last night, such as a Virginia Senate race between Mark Warner and Ed Gillespie that has ended up being far closer than any publicly released poll showed, a good deal of the polling in Iowa and Kentucky that purported to show the races in those states tightening, and the polling of the Maryland Governor’s race that apparently failed entirely to see that Democratic nominee Lt Governor Anthony Brown was in deep trouble in his race against Republican Larry Hogan. Some of these polling errors can obviously be dismissed as outliers, of course, but others, including the failure to see tight races in states like Virginia and Maryland, suggest something was fundamentally wrong with the polling models that were being used. There is, of course, likely to be much study of what happened with the polling this year, but in the first of what are likely to be several post-mortems on inaccurate polling during the 2014 midterms, Nate Silver notes that the polling this time around shows evidence of being faulty to the point where it was overstating the level of support for Democratic candidates in key races:
For much of this election cycle, Democrats complained the polls were biased against them. They said the polls were failing to represent enough minority voters and applying overly restrictive likely-voter screens. They claimed early-voting data was proving the polls wrong. They cited the fact that polls were biased against Democrats in 2012.
The Democrats’ complaints may have been more sophisticated-seeming than the “skewed polls” arguments made by Republicans in 2012. But in the end, they were just as wrong. The polls did have a strong bias this year — but it was toward Democrats and not against them.
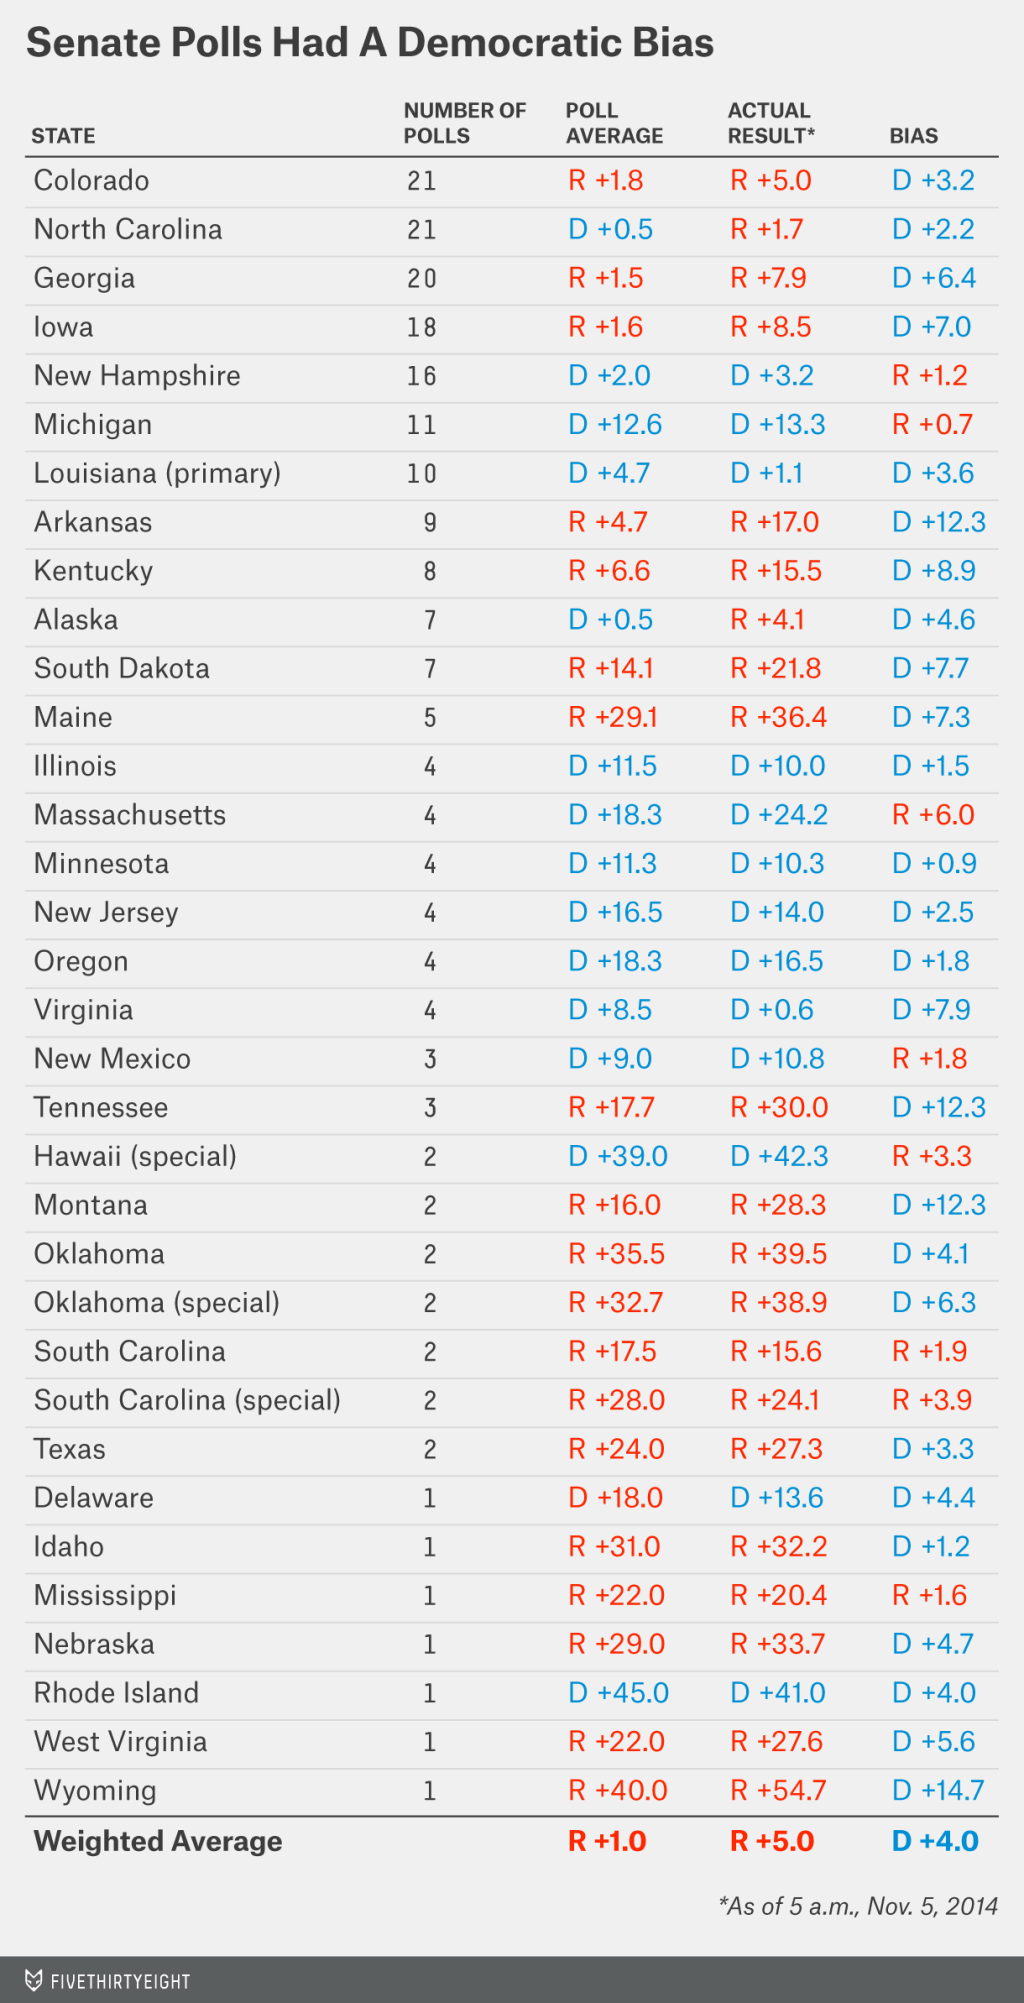
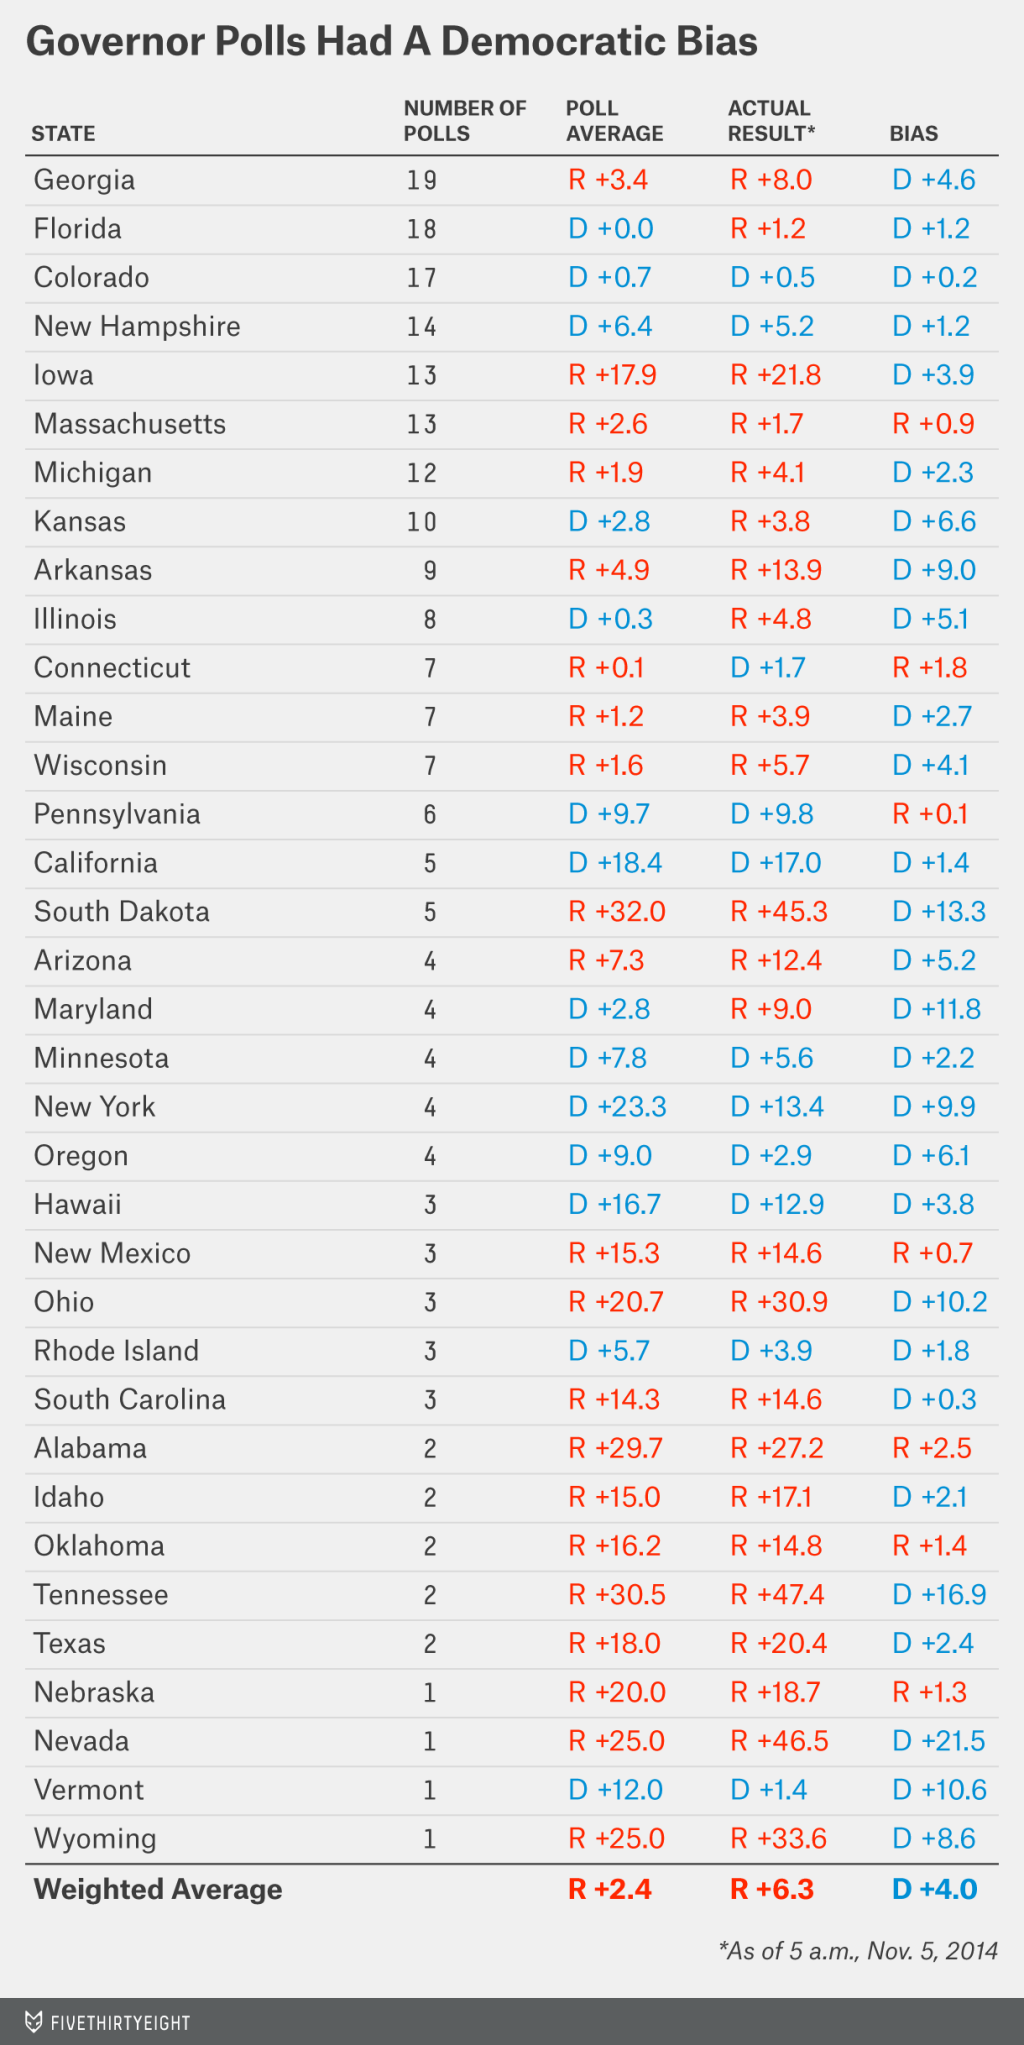
Based on results as reported through early Wednesday morning — I’ll detail our method for calculating this in a moment — the average Senate poll conducted in the final three weeks of this year’s campaign overestimated the Democrat’s performance by 4 percentage points. The average gubernatorial poll was just as bad, also overestimating the Democrat’s performance by 4 points.
The problem with Democrats’ claims is that they were one-sided. I don’t mean that in the typicalfalse equivalence way. I mean that they were ignoring some important empirical evidence.
This evidence suggests thatpolling bias has been largely unpredictable from election to election. Beyond the shadow of a doubt, the polling was biased against Democrats in 1998, 2006 and 2012. However, just as certainly, it was biased against Republicans in 1994, 2002 and now 2014. It can be dangerous to apply the “lessons” from one election cycle to the next one.
Our estimates of polling bias are evaluated in the same way we’ve assessed them in the past. They rely on a simple average of all polls1 released in the final three weeks of the campaign. Bias is calculated as the difference between the polled margin and the actual result. (For instance, a poll that projects the Democrat to win by 7 points when she actually wins by just 3 has a 4-point Democratic bias.) We exclude races in which one of the top two finishers was an independent candidate.
Here’s a chart that Silver produced showing how state level polls of Senate races tended to tilt toward Democrats: (click to enlarge)
And here’s the charge for Governor’s races:
Silver has some further comments:
This type of error is not unprecedented — instead it’s rather common. As I mentioned, a similar error occurred in 1994, 1998, 2002, 2006 and 2012. It’s been about as likely as not, historically. That the polls had relatively little bias in a number of recent election years — including 2004, 2008 and 2010 — may have lulled some analysts into a false sense of security about the polls.
Interestingly, this year’s polls were not especially inaccurate. Between gubernatorial and Senate races, the average poll missed the final result by an average of about 5 percentage points — well in line with the recent average. The problem is that almost all of the misses were in the same direction. That reduces the benefit of aggregating or averaging different polls together. It’s crucially important for psephologists to recognize that the error in polls is often correlated. It’s correlated both within states (literally every nonpartisan poll called the Maryland governor’s race wrong, for example) and amongst them (misses often do come in the same direction in most or all close races across the country).
This is something we’ve studied a lot in constructing the FiveThirtyEight model, and it’s something we’ll take another look at before 2016. It may be that pollster “herding” — the tendency of polls to mirror one another’s results rather than being independent — has become a more pronounced problem. Polling aggregators, including FiveThirtyEight, may be contributing to it. A fly-by-night pollster using a dubious methodology can look up the FiveThirtyEight or Upshot or HuffPost Pollster or Real Clear Politics polling consensus and tweak their assumptions so as to match it — but sometimes the polling consensus is wrong.
It’s equally important for polling analysts to recognize that this bias can just as easily run in either direction. It probably isn’t predictable ahead of time.
Silver promises more analysis of this issue to come, but the lesson to talk away from this seems to be two-fold. First of all, polling in and of itself is often as much art as science, especially when it comes to determining what an accurate “likely voter” model might be for a given election. If that model is off by even a little in one aspect or another than it could have a real impact on the quality of the poll that will be produced, and to misstate support for one or the other candidate depending on the impact of the errors that may have been made. This means that individual polls should be taken with a grain of salt, especially if they tend to deviate from the norms that other polls are showing. It’s possible of course that the poll that looks like the deviation is the one that’s accurate, but the odds are that it isn’t. The second lesson is that, contrary to what the media horse race watchers like to think, polling isn’t the Holy Grail that it has been presented to be and that other factors can tells us what might be going on in a particular race. As Silver notes, his models try to take those other factors into account, and as the race went on it was clear that the modelers like him were pretty much spot on in their assessment when all is said and done.
Another point that ought to be addressed is one that we touched on in the election night podcast I was a part of last night. Especially in the last four years or so, there has been a plethora of new pollsters coming into the business, many of whom seem to be fly by night operations that few people have ever heard of. With little more than a press release and access to social media, though, these pollsters can suddenly end up being taken as breathlessly as a established pollster like Quinnipiac or Marist and, depending on which website you look at, added in to poling averages with seemingly little assessment of whether or not they should be taken seriously. That last point, of course, is important because adding bad polls into a polling average tends to make the polling average less reliable. RealClearPolitics seems to be pretty careful about who they add into their averages, which is why I tend to rely o them when looking at numbers, but Talking Points Memo and Huffington Post both seem to take more of a kitchen sink approach and throw almost every poll taken in a given race into the average without consideration of reliability. Both of those sides do offer customization tools that allow you to filter out certain pollsters, of course, but the average user isn’t going to know enough about polling to know which companies to filter out and which ones can be considered generally reliable. All of this means that even when you’re looking at averages you may not be learning much.
Ultimately, of course, one can legitimately point out that we pay far too much attention to polling and who is ahead or behind at a given moment in a given poll. This is a fair point, and it’s one reason why, this year, I have tended to stay away from obsessively blogging about every new poll that is released like I admittedly did in 2010 and 2012. For one thing, there are simply too many of them these days to do that anymore. For another, there’s coming to be so much variation in the individual polling that spending the ten or fifteen minutes it takes to write up a post on one poll just isn’t worth the time. When I have written about polls, I have tried to be careful about comparing them to averages, as I did, for example, with that Bluegrass poll from a few weeks ago that purported to show Alison Lundergan Grimes leading Mitch McConnell which we know now was obviously inaccurate. Given that following the polls has become such a big part of political coverage on cable news and online, I’d humbly suggest that this kind of skepticism, which I hope to continue to adopt going forward, would be well warranted on everyone’s part.
If you just look at the most polled Senate races (more than 4 polls taken in the last three weeks as listed on Silver’s chart), the Democratic bias is an average of 5.1 percentage points. The polling is worse, the more polls were taken.
You could tell many of the polls were screwy when polls released the same day had widely differing results. And if you have two polls without overlapping measures of error you have to question the accuracy of one or both of the polls.
That’s why you’ve got to run these races, I guess. Pllla aren’t 100 per accurate and apparently will never be.
Gotta puick your aggregrators too. I’ll stick with 538, The MonkeyCage, and Sam Yang. They have proven to be at least consistently less wrong.
Problem is the polling probably tries to capture a microcosm of America by Age, Race, Party Affiliation etc… to gauge an election. Even when they poll “likely voters” it is wrong. Obviously their models don’t account for historical midterm elections turnout etc…- Anyone with a pulse could have told you what happened yesterday was going to happen…Did you really need a poll to realize that? I could tell in VA it would be a tight race for Senate just by going to vote. There was no turnout like 2012 – Democrats are doomed to be a minority in congress until they can figure out how to get people who vote democrat to actually go out and vote in a midterm election.
I think you might have missed the point, Doug. Silver isn’t talking about why individual polls might be off. We all know that that happens. He’s talking about why multiple polls converge toward a wrong answer. (Actually, looking this over, you might have everything right, but just a misleading headline.)
Thanks, Doug, for deliberately avoiding posts about the latest release of yet-another-poll. I agree that they appeared far less this year than in previous cycles. It is appreciated.
While true it leaves aside an important point- that off year polling currently has issues with determining a good likely voter screen. That seems to be where the issue came from- the demographics for last night’s election were extremely old and very white. More so than 2010 even. That was unexpected.
I second this. I especially tire of conservative websites that tout Republican-favoring outliers and liberal websites that tout Democratic-favoring ones. I’m interested in polls in a vague sort of way (which is why I follow Nate Silver) but the day-to-day horserace stuff is tiresome.
the only people who don’t admit that the left is pressed was trying to create its own reality, are leftists. That said, however, perhaps it would be interesting for each of you to have a look at this….http://graphics.wsj.com/exit-polls-2014/?mod=e2tw
the takeaway here is the slightly more leftists voted in this election andslightly less conservatives voted in this election in terms of percentage than in the 2010 election. In spite of that numerical advantage they still got their heads handed them last night.the data in this graphic suggest number of things not least of which is that the democrat leadership got their heads handed them in no small part by the Democrat rank and file…
theist press was trying to create its own assuming you don’t believe that the leftist press was trying to create its own reality,it seems clear that the electorate didn’t go the way they were expected to, particularly the democrat electorate. Does anyone not suppose that this would have had an effect on the results of the polling data?
Was there a single liberal who thought the Democrats would win both houses? I think all of them agreed that the House was a given for the GOP and the Senate would be extremely difficult to keep.
There’s no comparison to the Republicans and their assumption that Obama would lose 2012. Perhaps to the Democrats in 2012 (with respect to Congressional races) or 2010, I’m not sure.
@Eric Florack:
From your link:
Conservatives had a 37% to 23% participation advantage over liberals in this election, so I’m not seeing this numerical advantage you claim ”leftists” had. If anything it indicated that the left did better winning self identified moderates and independents in 2010 than they did this year. With this and your inability to understands the information in multiple links related to voter participation, I’m beginning to suspect you are incapable of reading graphs or charts.
@Eric Florack: Wow! An interesting interpretation. Please tell us more about it.
@Grewgills: You can see it clearly if you go with the Rush Limbaugh definition that a Moderate is a Leftist who doesn’t want to admit his leftist tendencies. (Also, consider the source’s perception of where the “right” and “left” might be on the spectrum, and I think you’ll see what he’s looking at.)
@Just ‘nutha’ ig’rant cracker: Yes, what he said. I know several people who consider anyone to the left of Ted Cruz to be a “liberal”.