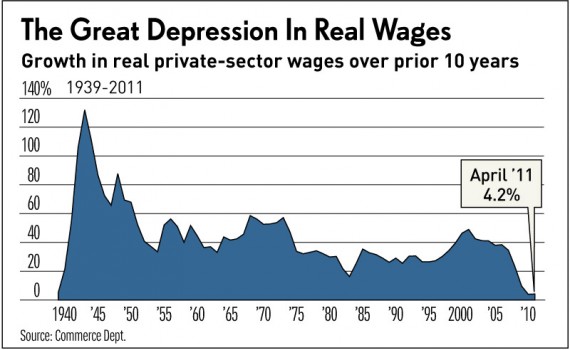
Wage Growth Over Past Ten Years Worse Than During Great Depression
The jobs market has been weak for much longer than just the past two years.
A rather astounding statistic from Investors Business Daily today that brings home not just the continued crisis in the jobs market, but the fact that things weren’t all that great during the recent period of low unemployment either:
The past decade of wage growth has been one for the record books — but not one to celebrate.
The increase in total private-sector wages, adjusted for inflation, from the start of 2001 has fallen far short of any 10-year period since World War II, according to Commerce Department data. In fact, if the data are to be believed, economywide wage gains have even lagged those in the decade of the Great Depression (adjusted for deflation).
Two years into the recovery, and 10 years after the nation fell into a post-dot-com bubble recession, this legacy of near-stagnant wages has helped ground the economy despite unprecedented fiscal and monetary stimulus — and even an impressive bull market.
Over the past decade, real private-sector wage growth has scraped bottom at 4%, just below the 5% increase from 1929 to 1939, government data show.
To put that in perspective, since the Great Depression, 10-year gains in real private wages had always exceeded 25% with one exception: the period ended in 1982-83, when the jobless rate spiked above 10% and wage gains briefly decelerated to 16%.
There are several culprits, of which by far the biggest has been the net loss of 2.7 million private nonfarm jobs since March 2001. (Government payrolls rose by 1.2 million over that span.)
That excess supply of labor has given employers the upper hand in holding back wage gains.
The one saving grace during a good part of the past ten years, of course, is that inflation has been kept relatively in check meaning that the small increase in real wages didn’t necessarily cause significant pain for the average American. With the economic downtown, the jobs crisis, and now an increase in commodity prices that has trickled down to the gas pump and the grocery store, that isn’t necessarily the case anymore. Not only do people need jobs, they need jobs that actually pay well, and there don’t seem to be a lot of those around right now.
The more interesting question, of course, is why the period from 2001 to 2011 would be so different from any other time in American history since the end of the Cold War. Simple supply and demand, of course, is part of the reason but there’s more going on than that:
There is a dramatic, decade-long job shift that has occurred. The often higher-paying goods-producing sector, including construction and manufacturing, has shed 26% of its workers. Meanwhile, typically lower-paying service industries have kept growing their payrolls: social assistance (41%), nursing homes (21%), leisure and hospitality (10%).
“To the extent you have more hotels and fewer manufacturing jobs,” the changing composition of the work force has been a negative for wage growth, said John Silvia, chief economist at Wells Fargo Securities.
Behind this job shift is the globalization of production, which has fed “the substitution of capital for labor” amid a push for productivity and competitiveness.
“Brain, not brawn, is required” for today’s high-skilled factory jobs in the U.S., Silvia said.
A third trend is the increase in nonwage compensation — fueled by the growth of tax-free health care spending — which has eroded real wage gains.
A fourth factor, rising food and fuel prices, has taken a bite out of real wage growth in the past year.
Of these factors, only one — the extent to which the increased cost of non-wage compensation, especially health insurance, has replaced actual wage growth — is something that could conceivably be changed easily. The others, most especially globalization and that the fact that a high paying factory job requires different kinds of skills today than it did 30 years ago, are largely outside anyone’s control. That suggests that the days of double-digit growth in real wages may be behind us.
Frankly, these strike me as being structural problems for which there may be no solution. But we’re Americans, and we don’t like being told the truth.


Well, I’m not sure this one should be really “astounding” either, given that some of us have been pointing to similar measures for some time.
Just the same, it is a better way to look at our problem(s) than a short-term (noisy) measure.
FWIW, globalization could be “easily” changed by trade policy. We haven’t for cultural reasons. Essentially “free market, free trade” found acceptance in the segments most damaged by the same.
@John,
The economic and political arguments against enacting restrictive trade policies are fairly self-evident. Globalization is a force that cannot be stopped and, on the whole, it’s a good thing. However, it leads to structural changes that make it clear that the America of the 1950s isn’t coming back.
Doug, that is about the most self-contradicting non-argument I’ve seen.
If I read you’ve right, you say we cant stop the bad globalization, because “for reasons that are self-evident,” globalization is good.
(Duh, the whole point of your “10 year wage growth” datum is that maybe it isn’t good!)
So, companies continue making profits, the stock market keeps going up, but nobody wants to actually invest that money back in the people who do the work, is that it? That sounds like less of a structural problem and more of a greed problem…
A long time ago (around 1975, I think), I had a conversation with a trade negotiator whose book I was editing. Some story in the paper about China prompted the discussion. He told me that there would be no way that American workers would be able to compete with low-wage foreign workers in the coming new world manufacturing order. No way at all. The down escalator was all he could see for American workers.
The serious political problem for us is that while incomes for those not in the financial industries have been stagnant or retreating, incomes in the financial sector have exploded. I cannot believe that the long-term effects of this imbalance on the national consciousness can be at all good for our country.
sam, that makes me think the conservatives are looking for the socialists in the wrong place. It won’t be entitlements for the young, the liberal, that tip things. It will be a demographic wave of retirees without savings, who vote themselves benefits, perhaps while hating on the liberals all along.
Perhaps that’s what the Tea Party really is already, an argument about the kind of socialism, and who gets the benefits.
i have to say that anytime I see a graph with 14% I get nervous…
having said that – you need to look at the range of income, and thus income inequality, as well. while the middle class has been flat-lined, since reagan and the beginning of the catechism of slash taxes and slash regulations, the top 10% has been raking it in. but reagan’s claim of a rising tide floating all boats just has not happened. it’s the middle class that drives demand and demand is the engine that runs the country. the failed theory of supply side economics – and yes that is the ideology the so-called republicans are still preaching – just does not work. it has been proven not to work. it’s time to move on. you have to enpower the middle class and abolishing medicare, solely to create more room for more tax cuts for the rich, is not going to do it.
http://rwer.wordpress.com/2010/09/20/graph-of-the-week-the-top-10-income-share-in-usa-1917-2008/
that should read 140%
Yeah, I don’t quite understand the graph. Because I don’t really remember getting 40% raises every year in the early 2000s. It’s not the sum of all wages, either, because there wasn’t 40% more people getting wages every year. What does it all mean?
Please nevermind me. I didn’t quite grasp the significance of the term “over prior 10 years”.
Franklin, it is a “look back” at the previous 10 years, with each year as a reference point.
So the massive 135% gain “in” 1942 is really saying that there was 135% gain from 1932 to 1942. That’s about what we’d expect. (I just saw The Best Years of Our LIves on cable, and man, that showed that even in 1946 poor was poor. Dana Andrews’ family under the railroad tracks …)
So anyway, if high-30’s were typical for the last half century, that means that people were gaining that much over 10 years, or approx 3% per year.
(hah, and I took so long typing that up 😉
This isn’t true at all because the graph is counting real wage growth, which is already adjusted for inflation.
Wait a minute. The graph starts with 1940. That first data point records wage growth relative to a baseline in 1930, which is already post-crash.
What are the numbers for 1939, or ’38, or .37 That would show wage growth relative to conditions in the “roaring twenties”, and would give an accurate picture of whether current wage growth is really “Worse Than During Great Depression”.
I thought wages were stagnate for decades, or at least that was always the refrain from liberals. 25% gains on average? I’m curious about this discrepancy.
Perhaps I’m just misreading the above…. but what’s the easy way to change this?
The more I look at that table the more I want to see what data they are using. They list their source, but its pretty bad since the Commerce Dept. has several agencies that could have compiled that data.
Steve, isn’t it just “middle class wages” versus “private sector wages?”
This data set includes all workers, yes?
Looking at total private sector wages doesn’t really tell the whole story because our mediocre executive class has been receiving rather nice real wage increases over the past decade, while regular workers’ wage are flat or even declining.
Certainly, it’s been more than just the last two years, Doug… but that seems a flimsy defense of the Obamites. It is Democrat policy, their way of thinking, that led us to this pass. Unions, who cannot long exist in a competitive market, ever higher government spending ever larger government are all ideas and ideals of the left.
The word unsustainable comes to mind… a problem the left seemingly has no issue with when used on energy consumption… even though they;ve no clue what they’re talking about…. but one they cannot get their flimsy minds around when it comes to this stuff.
i always thought the argument was that middle class wages were stagnant relative to skyrocketing upper class wages. wages obviously werent flatlining for decades.
point taken, though
yes eric, it is all 100% the fault of demoncrats, unions, saul alinsky, jimmy carter, the flying spaghetti monster, the weathermen, and that kenyan socialist usurper in the white house. 40 years of status quo politics, and essentially one party rule, has nothing to do with it.
seriously, get a little more perspective, man.
I don’t know, that is why I’m becoming skeptical. 25% wage increases is pretty steep. Is it total wages paid which the Census Bureau compiles or is it something else. Does it include salary (I’m paid a salary not a wage, you could calculate an imputed wage, but then they should tell us that).
Ideally I’d say look at the median wage. If this is all pay–i.e. wages and/or salary then it could be that what we are seeing is a drop in the growth of top level wages (e.g. a decline in salary and bonuses to people in the financial sector)?
BTW, when I mentioned the stagnant wages that liberals bring up, I wasn’t intending to sound partisan. I’m truly curious about this discrepancy. Maybe it is legit and it is just that wage growth amongst top wage earns has flat-lined. If that is the case, maybe it isn’t as horrendous as it appears. I really don’t know, the data they are using is not clearly spelled out.
Tano’s got a good point about starting in 1940. If the graph started in, say, 1935, it might work better as a comparison to “wage growth during the Great Depression.” As it stands, it’s a comparison to Wage Growth during the *recovery from* the Great Depression.
I just noticed the source of the article – IBD. IBD, in my experience, is crap (the only articles I’ve seen linked from them in the past have been absolutely crazed wingnutty stuff about how the Obama monster is destroying everything). This might explain their attempt to draw a conclusion (wage growth has been worse from 2001-2011 than it was “during the Great Depression”) from data that doesn’t actually support that conclusion. Wingnuttery and sloppy slights of hand seem to go together.
That said… it’s hardly nutty to point out that wage growth 2001-2011 has sucked. I’ve seen various graphs posted on liberal blogs over the past several years, all bemoaning the plight of the middle and working classes, while complaining about the rich getting richer. This seems to be borne out by the statistics (though the superrich did, of course, take a hit in the ’08 crash). The top ~5% have kicked ass and the rest have stagnated. The result, averaged out, looks mediocre, but if you consider that the gains are concentrated and most of the population has been left out, it’s actually worse than mediocre.
The plots wage growth over the previous 10 years.
So, the point for 1940 shows wage growth between 1930-1940, which covers almost all of the Great Depression.
Er, The chart plots wage growth over the previous 10 years.
Highest paid athletes in the world:
1990 – Mike Tyson Boxing $28.6 million
2000 – Michael Schumacher Auto Racing $59 million
2010 – Tiger Woods Golf $105.0 million
http://www.topendsports.com/world/lists/earnings/forbes-index.htm
There is a bunch of income by quintile (and by median) on this wikipedia page.
You can get zero growth from it, if you are using 1999-2009 data, for middle income families, specifically.
Still not seeing it JP. Sure you got the 0% but what about the 25%? Even looking at the richest tier, sometimes the increases hit 25% over the course of a decade, but when aggregating I don’t think you’d stay in that neighborhood.
@Steve. I don’t believe anyone made the claim that the long term, broad measure, was zero. Is that’s what confusing? What I remember are claims that the last 10 years did nothing for the middle class. And sure, when looking at data sets and different accumulations (instantaneous increases versus 10 year sums) there is going to be some variation.
While I’m here, I’ll note something I also mentioned on Dave’s site, as Strongly Related:
That from a Time article on Why Don’t Jobs and Corporate Profits Match Up?
@Eric
I don’t quite follow your logic here-
You see a graph showing that wages have been stagnant for a decade, and your response is that it is the fault of the liberals, and unions that demand high wages?
Are we supposed to think that if only workers had been willing to get paid a lower wage, then wages would have…risen?