Economic Class and Voting Behavior
 Andrew Gelman posts the familiar Red-Blue map of the 2004 election with a twist: What if only poor people’s votes counted? Only the middle class? Only the rich? The results are posted at right.
Visually, at least, it’s a Republican blowout if the poor are excluded and a Democratic landslide if only the poor vote.
Reading inside the data, though, Gelman and his colleagues found something more striking:
For poor voters, there is no systematic difference between rich and poor states. But for middle-income and especially for rich voters, there is a very strong pattern of rich states supporting the Democrats and poor states supporting the Republicans.
Thus, the familiar red-blue divide of cosmopolitan coastal Democrats and heartland-state Republicans shows up among the rich but not the poor.
Henry Farrell weighs in:
Gelman et al. don’t have any hard and fast explanation for this (they note that race explains about half of this disparity, but only half). However, their results do suggest that some of the conventional wisdom of American journalists on class, voting and geographic location stands in sore need of revisiting.
I’d note that half the disparity is a hell of a lot. Further, is it all that surprising that there’s more regional variation in the voting behavior among well-off voters than poor ones? Rich and middle class people on the coasts and in major urban centers live much different lives than their counterparts in the rural and suburban areas. Poverty, meanwhile, tends to look the same everywhere.
UPDATE: A commenter at Matt Yglesias‘ place makes a good point:
In high-cost-of-living states like New York, New Jersey and California, there are a lot of people who qualify as “rich” by national standards, but not by local standards. By local standards, they’re middle class, so we should expect them to vote like other middle class people.
Quite so. That’s the problem with using income as a proxy for social class across a diverse population.


Is Henry Farrell usually in the habit of partially contradicting himself? They have no explanation, but half an explanation. Brilliant. I don’t have any diet coke, just half a can.
If you look at the states EV, you see the hill the GOP has to climb. Start with the states that went one way or the other from top to bottom. 7 states + DC went dem top to bottom for 137 EV. 9 states went GOP top to bottom for 66 EV (better than 2 to 1 advantage to the dem). So starting out with states least likely to switch, the dem have a strong advantage.
Switching to the states that got 2 out of 3 (with the middle class voters the swing). The dems pulled 130 EV while the republicans pulled 197 EV (to make up most of the difference.
But the real contest is in the states that could have gone either way. Setting the bar at 5% (or actually 5.01% to include Florida), the dems had 88 EV they won, but by less than 5%. The GOP had 48 EV they won, but by less than 5.02%.
A little more enthusiasm in any of the three catagories (poor, middle class or rich) could have swayed any of those 136 EV and thuse the election.
definitions? rich? poor? middleclass?
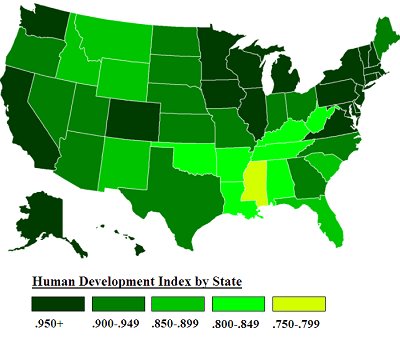
Judging from the charts, the deep south is a lot better off than conventional wisdom implies.
Another point to consider the rich and middle class are more mobile and are able to choose where they live far more than the poor.
They divide the population into thirds by income.
The lower third of the population extends up to a little over 2x the official poverty level*.
Median individual income is about 32K and from a quick look at the graphs income is pretty bunched around this so I would guess the upper third starts somewhere in the low to mid 40Ks for an individual and the low 60Ks for a household.
All deep south states other than GA are in the bottom third of states for household income (GA is 22). 3 of the bottom 5 states are inarguably deep south. The other 2 are AR and WV. Conventional wisdom gets this one right.
*poverty = $10,294 for an individual and 20,614 for a family of four.
I skimmed the study and couldn’t tell. That strikes me as an odd metric. Standard deviations from the poverty threshold makes more sense to me. I presumed they were using standard sociological definitions.
Yep. Then again, we have the problem of “income” as the proxy for “living standard.” Lower taxes and housing costs makes $40,000 go a hell of a lot farther in Alabama than in Connecticut.
It was hidden in the footnotes. They actually borrow the NES system breaking down the population into quintiles 1 = 0—16 percentile, 2 = 17—33 percentile, 3 = 34—67 percentile, 4 = 68—95 percentile, 5 = 96—100 percentile for their regression analysis.
For the graphs they appear to lump 1&2 as poor, 4&5 as rich and 3 as middle income.
From salary wizard, Alabama
Connecticut
For all but the very poor income tax is the same in both states.
Maximum state and local retail sales tax is 11% in AL and 6% in CT. (8.9 in CA and 8.7 in NY) Food is exempt in CT (also CA and NY) but not in AL.
Alabama does have a lower gas tax.
AL has a much lower cigarette tax, but a much higher alcohol tax than any of the other three.
Housing costs are a lot lower in AL (and much of the SE and MW) as are auto insurance rates which help your money go considerably further.
So how does the study account for the “poor” Southern states consistently voting Republican in national elections?
Here is the paper.
Grewgills; Thanks.
Floyd
Read this thing!! It is Truly interesting!
The “discussion” section Pages 18-23 are particularly interesting. The only real distraction may be the tendency to constantly check the “by line” to be sure it was not written by Douglas Adams!
Yep. The other thing is that Alabama has absurdly low property tax rates built into the 1903 constitution. I’m not sure if it’s still the case but five years ago it was said that if Alabama doubled its property tax rates, they’d still be the lowest in the country.
$100,000 will still buy a fairly decent house in most Alabama counties and $200,00 will buy a nice one pretty much anywhere in the state. That’s just not true in California or most of the northeast corridor.
$200,000 in New England would be lucky to net you a very small fixer upper. It is tough to find anything for $100,000 in New England.
The other thing is that Alabama has absurdly low property tax rates built into the 1903 constitution. I’m not sure if it’s still the case but five years ago it was said that if Alabama doubled its property tax rates, they’d still be the lowest in the country.
Not sure about the doubling part, but they do have a very low tax rate. When my husband was in the Navy we always kept his residency in Alabama, because we saved tons of money on our property taxes for our car. I think the whole tag and tax on the car was $65ish dollars. When we thought about changing residency and learned that the tax on the car where we were living would have been close to $300 we stayed with Alabama.
Property tax rate in AL is 0.31%, 1.42% in CT, 0.48% in CA, and 1.19% in NY. (0.20% in HI)
The differences in real estate prices is about demand rather than taxes.
You will end up paying more property taxes on a house in CA the NE or HI than you would on an equivalent house in AL. Most of this difference though is due to actual difference in property values rather than tax rates which are in some cases lower.
You will end up spending about $1000 dollars more in fees and taxes over 5 years on a new Camry in AL than in CT*, but not having to pay 7% or so on your food over that time should more than make up for that. You could of course illegally keep your car registered in AL and save money on both ends.
You could keep your legal residence in TX and avoid paying state income tax as well as Bush 41 and 43 did**.
* 2.00% in AL vs 6.00% in CT, 7.90% in CA (highest in the nation), 4.25% in NY and 4.00% in HI
** AK, FL, NV, SD, WA, and WY would work just as well. I guess it is arguable that 43 actually lives more in TX than in DC.
Oh it is all moot now. He is no longer in the Navy. We live in NH, no sales or income tax, but property taxes can be a doozy depending on where you live (property tax is set by community).
But given that while in the Navy we paid virtually nothing in income taxes because of how small his paycheck was (we had two children by the time all was said and done) and various deductions-our income tax was pretty much nothing to the feds and very little to the state of Alabama. So it paid to not change his state of residency while in the military.