Race Still Tied After Biden Pick
CNN is breathlessly reporting that Barack Obama and John McCain are now tied and that the selection of Joe Biden as Obama’s running mate has hurt the ticket.
It’s a dead heat in the race for the White House. The first national poll conducted entirely after Barack Obama publicly named Joe Biden as his running mate suggests that battle for the presidency between the Illinois senator and Republican rival John McCain is all tied up. In a new CNN/Opinion Research Corporation poll out Sunday night, 47 percent of those questioned are backing Obama with an equal amount supporting the Arizona senator.
“This looks like a step backward for Obama, who had a 51 to 44 percent advantage last month,” says CNN Polling Director Keating Holland. “Even last week, just before his choice of Joe Biden as his running mate became known, most polls tended to show Obama with a single-digit advantage over McCain,” adds Holland.
So what’s the difference now? It may be supporters of Hillary Clinton, who still would prefer the Senator from New York as the Democratic Party’s presidential nominee.
Another alternative: It may be that CNN’s polling director is a hack.
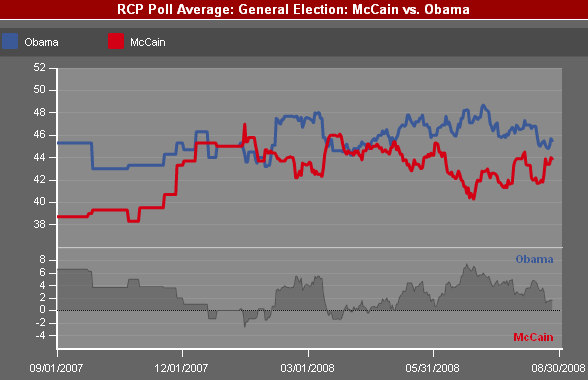
The race didn’t “become” tied after Biden’s selection. It was already tied. Indeed, the race has been essentially tied for, oh, six months:

The degree of variation in the chart is exaggerated by the scale: McCain’s entire movement over the past year has been between 39 and 47 and Obama’s betwen 43 and 49. Since Obama secured the presumptive nomination of his party, there have only been very short periods of significant disparity.
That there’s been some wild variation in CNN’s own poll is of only mild interest. It’s just one poll. And that Obama’s down within the margin of error in the last few days in that poll is of no interest whatsoever: That’s random fluctuation that’s mathematically expected.
You learn that in your first lecture on polling; it’s inconceivable that Keating Holland doesn’t know that. That he’s willing to pretend otherwise to try to generate “news” is just sad.


Or, alternatively, Keating Holland has never taken a course in polling or statistics. The biographical info is pretty scanty but it looks to me as though he or she was a journalism major.
I don’t know what things are like now but back when I was in school I didn’t know a single J-school student who ever took a math course.
Eh… well, look, some polls did suggest Obama was behind a few points, so if that’s no longer the case, it COULD be spun to say that the Biden thing caused a slight uptick.
But, James, I suspect and suppose you know as well as I do that if we were talking about McCain, and his pick, and the polling response was this tepid, the phrase “dead cat bounce” would be out in force in the Dinosaur media.
Just wondering….why do you say, “The degree of variation in the chart is exaggerated by the scale,” when both the horizontal and vertical scales are linear? I don’t understand…
It’s the constraint on the range between 38 and 52%, Houston. If the range were 0 to 100% it wouldn’t look quite so dramatic.
Houston: Dave answers the question.
Because the vertical axis ranges only from 39 to 49, even a swing of 3-4 percentage points looks dramatic.
OTOH I think the horizontal axis is too long. You can tell how the lines become much more jagged around Jan/Feb of 2008. Not a lot of polling data before then.
I also can’t help but think there hasn’t been enough time to really measure the affect of the Biden pick. The announcement came over the week end, which left maybe two days on what at least here was the nicest weekend in months.
I think the polling reflect a close race. Not sure that it has any reflection on how the Biden pick is going to affect them.
I agree; its a Sunday night poll and I don’t think there is a lot of precedent for VP selection bumps anyway.
And there was something else that happened at the end of last week. Obama personally went negative (the house issue) in a way that I had not ever seen him before.
With a vertical axis ranging from 39-49 pct, a swing of 3-4 points is in fact dramatic, is it not? In such a tight race, these are significant changes. Thus the figure does not exaggerate.
It gives the misimpression that wat is likely random sampling error is meaningful variation. That’s problematic.
Your point is an arguable one, James, from both sides, no disrespect to you, here.
I agree that numbers that narrow tend to point to a statistical burp as much as anything. But the timing of the change in direction does seem to me to counter that argument to some degree.
As an example… did the numbers shift because of no particular ascribable event? Well, then a statistical hiccup seems more likely a reason. Is there an event we can logically hang the change on? Somewhat less so.
Houston’s point is well taken; We’re going to be dealing with numbers this tight all through this cycle, if the last few cycles are of any indication. Hell, the votes themselves were on a national basis within the statitsical margin of error. At what point do we begin to logically assume that the (small) number shifts we’re seeing are genuine, despite also being within the MOE?
Hard thing to judge, this.