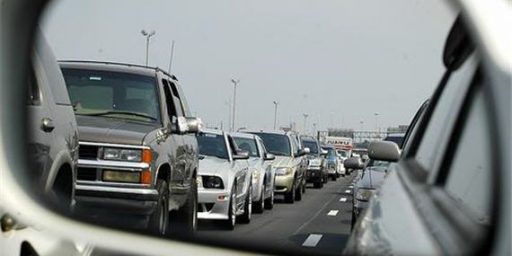
REALLY?
WaPo has learned that, if fewer people drove to work, there would be fewer cars on the road during rush hour. What’ll they think of next? Well, maybe math classes:
For every additional 3 percent of commuters who worked from home on any given day, traffic delays would be cut by 10 percent, Schintler said, based on projections using computer traffic models.
So, if 30 percent of those now driving stopped driving, there would be no traffic? How does that work, exactly?


You’re not dealing with a truly deterministic system; instead, it’s all agent-based (each vehicle is somewhat independent of the others, but not completely). At saturation levels of traffic, removing just a few cars from the road will drastically improve the flow.
Think of it this way: one guy tapping his brakes doesn’t just slow himself down, it slows down hundreds of other people behind him due to the knock-on effect (you brake so I brake so the guy behind me brakes…). The less traffic, the bigger the gap between cars and the less need for individual drivers to react to others.
Chris,
Sure. But it also has to be a curvilinear pattern, no? For the reasons you note, removing the first three percent of cars would have to have a more dramatic effect than the fifth three percent. Otherwise, as I say, you’d have no traffic delays with 70 percent of the cars on the road. That can’t be right.
You’ve obviously never played Sim City, James.
IIRC the effect is close to exponential, but with a long flat area until you get close to capacity (this is why highways generally go from 55 mph+ to stop-and-go or a crawl, rather than just slowing down to a lower flow speed).
This page explains some of the concepts. This table gives an idea of the relationship between volume and level of service; note that LOS A (the best possible) typically is sustained through 60% of nominal capacity and things really only break down at LOS E near 90%.