Tax Freedom Day
Monday was “Tax Freedom Day,” the mythical date when Americans had finished paying off their obligation to government and begin “working for themselves.” I saw a few stories about it but ignored it because it’s “news” only in the sense as the annual stories about how the day after Thanksgiving is the biggest shopping day of the year (it isn’t) and how retail business establishments finally reach a profitability halfway through Christmas season (which is nonsensical), and other perennials.
Julian Sanchez, whose disdain for taxes is unquestioned, says it’s all bunk.
TF [The Tax Foundation] will accurately talk about the time “the economy as a whole” takes to pay its taxes. But these accounts almost universally use language like “the average taxpayer” or “the average wage earner.” These are totally different. Any claim that TFD somehow measures this latter figure is just unambiguously false. TF’s own claim is just barely honest in a highly pedantic sense thanks to their judicious placement of quotation marks: They’ve measured the “average” American tax burden but damn if that isn’t worded as to almost invite the misreading that they’re measuring the “average American’s” tax burden. They’re not, despite widespread press coverage giving that impression, which TF seems to feel no need to correct.
The word “average” is generally taken to be “arithmetic mean” rather than “median.” Averages can be skewed by extreme outliers but that doesn’t make them non-averages, just poor measures of central tendency.
Further, Tax Freedom Day does not represent, as Julian implies with an ancedotal illustration involving 100 taxpayers, the date when federal income taxes have been paid. Rather, it seeks to answer the question, “What price is the nation paying for government?” State and local taxes, which include sales taxes, tend to be “regressive,” constituting a greater burden for those lower on the economic ladder than they do for the well-off as a percentage of income. Ditto, Social Security and Medicare.
Julian asks, “If you just want to look at the total magnitude of America’s tax burden, why is a date any more illuminating than just giving a percentage of GDP?” For the same reason that anecdotes are more powerful than the recitation of dry statistics. Or that video is more jarring than text. It helps illustrate a point in a way that captures the imagination.
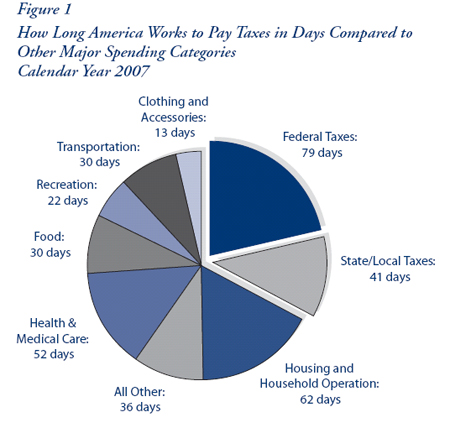
Curtis S. Dubay and Scott A. Hodge, in their Executive Summary of this year’s report, observe that, “Americans will work longer to pay for government (120 days) than they will for food, clothing and housing combined (105 days). Since 1986 taxes have cost more than these basic necessities. In fact, Americans will work longer to afford federal taxes alone (79 days) than they will to afford housing (62 days).”
TF provides this handy-dandy pie chart to illustrate the “Days Americans Work to Pay Taxes Compared to Other Expenses:”
Sure, some people pay much less in taxes and are “free” much sooner; others pay much more and “work for Uncle Sam” much further into the year. But, as a marketing device, Tax Freedom Day strikes me as perfectly valid.
Now, presumably, pro-tax people could come up with some interesting heuristic to illustrate the benefits people receive from government and help make the case that we should be spending more for government services than we do for food, clothing, or shelter. Interestingly, they haven’t.


“The word ‘average’ is generally taken to be ‘arithmetic mean’ rather than ‘median.’ Averages can be skewed by extreme outliers but that doesn’t make them non-averages, just poor measures of central tendency.”
I think you miss my central point: EVEN IF we’re looking for an arithmetic mean, the TF number is wrong if we’re taking it to represent *the average (mean) taxpayer’s TFD*. If you wanted that number, you’d get a time required to pay off one’s taxes for each individual, then take the mean of those times. And that would yield a very different result from just taking (tax burden)/(GDP) and converting it into a date.
The overall cost of government services can be illustrated in many ways so why not use all of them? Different approaches may strike a nerve with different people and overall send the message in a more efficient manner than one method repeated over and over.
I can’t hardly blame them for using misleading “averages” since everyone does it.
The important message that needs to get across is how much we pay in hidden taxes. Those taxes that are built into the cost of our everyday expenses and not itemized like payroll deductions, sales tax or a check on April 15. Those taxes add up quickly and burden Americans more than they realize.
TF claims that the average (that is, mean) taxpayer pays 32.2 percent of his income in total taxes. [PDF, p. 1 and 2; also available in exec summary.] That works out to 119.355 days (which they, oddly, round to 120 days).
I’d agree that using GDP, which includes non-income in the equation, would be misleading, although it would seem to skew the data in the other direction, no? At any rate, they claim to be using income:
Interesting idea. Maybe the “pro-tax” people should make a movie… kind of like “A Day Without a Mexican,” only showing what life would be like without government.
I’m working on a construction site right now. Without OSHA, it would certainly be a lot more “interesting” without the safety belts, railings on scaffolding, GFI circuit breakers, etc. (There has been a 90% decrease in workplace deaths between 1933 and 1999 due to government safety regulations, and a corresponding decrease in accidents of all sorts).
I’m sure other aspects of our lives would be equally interesting without those other pesky federal agencies. No interstate highways (or public roads of any type), no Food and Drug safety, no public schools…
Freedom isn’t “free.”
Most people have no clue whatsoever how much they pay in federal income tax. Unless you making a lot of money the idea that you pay much more then 15% after deductions are considered is unlikely. In the computer boom years I was making well above the mean and median and paying an effective rate of about 18%(under Clinton rates), a far cry form the 32% mentioned. Most people don’t pay anywhere near that but this kind of misleading stuff makes them think they are getting raped.
I would like to know what % of tax the libertarian minded think is acceptable?
far cry form the 32% mentioned
Again, though, the figure does not represent just federal income tax. It also includes, FICA, Medicare, state income taxes, local income taxes, property taxes, sales taxes, and excise taxes.
It’s unclear to me whether it also includes the passed-on cost of corporate taxes paid by consumers or the additional costs imposed by regulations. Reading the report, it does not look like it does.
Indeed, 32 percent may well be low in expressing the true “cost of government.”
If we include this magic number, we should surely include the additional costs imposed by lack of regulations.
So what’s the controversy here? It says right there on the website (http://www.taxfoundation.org/taxfreedomday/) that it’s “calculated by dividing the official government tally of all taxes collected in each year by the official government tally of all income earned in each year.” How stupid do you have to be to not understand what that means, mathematically?
Representing the ratio of tax receipts to GDP as a calendar date is silly and misleading, and has little to do with how much an average or median American has to work to cover their taxes, which is what the media stupidly presents it as.
What if you cheat? I don’ see that on the chart.