Economic Volatility
The CBO is reporting that macroeconomic volatility has declined, but at the same time earnings volatility has remained fairly high and that this volatility to income and earnings has possibly increased. The report’s main findings are,
- First, macroeconomic volatility—the ups and downs of overall economic growth and inflation—has declined and is now relatively low. In particular, year-to-year fluctuations in the economy have become smaller than in the past.
- Second, despite the relatively modest volatility in the overall economy, workers and households still experience substantial variability in their earnings and income from year to year. CBO’s analysis shows, for example, that between 2001 and 2002, one in four workers saw his or her earnings increase by at least 25 percent, while one in five saw his or her earnings decline by at least 25 percent. Some of that variability stems from voluntary actions, such as a decision to stay home and rear children, and some stems from involuntary events, such as the loss of a job. Earnings volatility is somewhat higher for people with less education.
- Third, although earnings and income volatility is substantial, more research is required to determine how and when that variability has changed over the past few decades. The evidence that exists suggests that earnings have tended to fluctuate more, on a percentage basis, over the past 25 years than they did during the 1970s. The number of studies on the topic is limited, however, so it is too early to reach firm conclusions about the precise timing or magnitude of any increase. Given their importance, trends in income volatility seem to warrant significant research attention.
- Finally, while the unemployment rate has been relatively low in recent years, the adverse consequences of losing one’s job appear to have increased. In particular, a higher fraction of unemployed workers remain unemployed for very long periods, and the average reduction in earnings once they are reemployed appears to have grown.
I’ve known that economic growth has become less volatile and the CBO report gives the variance for both growth and inflation. The variance for economic growth from 1950 to 1984 is 3.1 whereas from 1985 to 2005 it is 1.4, less than half. There is an even larger decrease for inflation with the 1950 to 1984 variance at 2.9 and for 1985 to 2005 at 1.0.
And the report’s findings on household earnings and income supports John Quiggin’s story/theory of why we have seen an increase in the number of bankruptcies.
Also, my suspicion that there has been a change in how unemployment works with recessions also seems true.
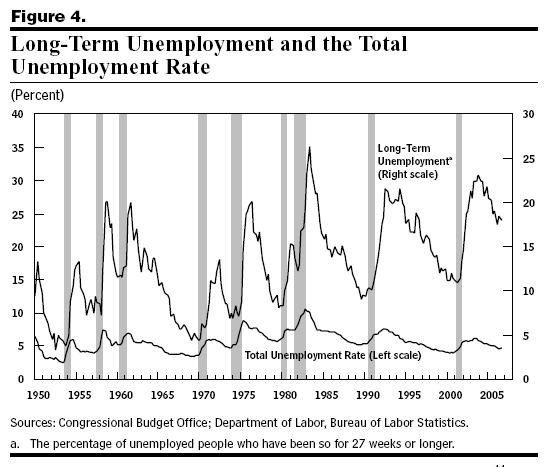
While the peaks for long term unemployment during the last two recessions are lower than the global peak in the early 1980’s people appear to remain unemployed for a longer period of time.
So overall the economy has become less volatile, yet earnings and income have remained subject to some fairly large volatility and this volatility may have even increased.


It’s hard to believe what macroeconomic analysis has become. High GDP growth and high price stability have been achieved as never before, but there are some people that still pretend to earn money by crying wolf. There is no need to construct a theoretical model to think of the possibility that the higher long-term output growth is, the higher income volatility will be because of increased opportunities to change the uses of all capital, including human capital. Apparently empirical analysis to explain increased volatility has yet to be published, but I’m sure many macroeconomists have been working hard to find evidence that it is NOT related to increased opportunities and so far have failed to find it. The final point about the unemployment rate shows how stupid this game has become: even in the 1960s it was commonly assumed that the lower the unemployment rate, the longer it will take the remaining unemployed to find a job. I’d be not surprised if the evidence supporting this is hard; it will confirm that labor markets are really working fine (under current conditions, if you cannot get employment in a few months it is either because you don’t have the skills that are being demanded or because you are looking in the wrong place and refuse to move; they are sources of frictional unemployment).
Edgardo,
Did you read the report? It noted that the number of people experiencing up to a 25% decrease in income/earnings was 1 in 5 while those experiencing an increase were 1 in 4. This seems to suggest that while there are increased opportunities not all of them are good. Personally, I’d find a 25% decrease in my income/earnings very problematic. If the decrease also included my wife’s income/earnings it would be extremely bad.
I guess you are unaware of the paper by Groshen and Potter that look at cyclical vs. structural changes in unemployment for the last two recessions. Structural unemployment is becoming the dominant form of unemployment, hence your observation while interesting doesn’t go all that far in explaining the problem.
Also in looking at the graph from the CBO article it seems quite likely that the rate of long term unemployment is much lower when total unemployment is low. My comment was about the rate of unemployment, perhaps I was unclear on this. In any event your comment is unhelpful in that it is considerably higher after the last two recessions than in than the late 1980s.
The other point that the CBO report does not point out is that the decrease in economic volatility has been accompanied by a modest slowdown in growth.
From 1950 to 1983 the trend growth rate of real per capita GDP was 2.2% but since 1983 it has slowed to 1.9%.
But I think the nature of unemployment has changed dramatically between these two periods. In the earlier era cyclical unemployment was typically a laid off durables goods worker, like auto workers, that viewed the unemployment as temporary and fully expected to soon return to their old job.
But in the modern era a lay-off is a very different thing. People are fired, not laid-off and do not expect to soon return to the same job.
Wow, Steve, as an economist you are a very pessimistic one. Wait-you are not an economist???
Fact is, it has been 6 years now that our economy has been under the tutelage of the Bush administration. After inheriting a recession from Clinton, Bush has guided our economy to a strong recovery and expansion even through such cataclysmic events as the tragedy of 9/11; the war on terrorism; hurricane Katrina; and high fuel prices. The strong job market and increasing wages have helped fuel this 63-month and counting economic expansion. GDP growth in 2006 was a strong 3.4%, close to its four year average. All this while keeping inflation and interest rates low.
Over the past 3 years the deficit has shrunk 58%. The Congressional Budget Office estimates that the current fiscal year deficit will fall to $172 billion, even after including continued Katrina relief; homeland security spending; and war spending of approximately $200 billion. In fact total US federal debt as a share of GDP is less than Germany, France or Japan.
How is all this possible? Mostly due to Bush’s supply-side tax cuts that have spurred the economy and resulted in increased tax collections of3/4 of a trillion dollars. Hopefully democrats in congress will do a better job than republicans in reigning in federal non-defense spending. But more importantly they need to make the Bush tax cuts permanent. Expiration would not only result in the largest tax increase in history, but it would surely end the economic success that the Bush administration has painstakingly, and for all Americans, lucratively produced.
Steve,
I have just read your post. Also over the past 50 years I read a lot of macro analysis of the US economy and many other economies (and I earned a lot of money advising companies and governments). Sorry if you cannot see that the US economy is right now having SIMULTANEOUSLY the highest (a) level of per- capita output, (b) long-term growth rate, and (c) level of price stability of the past 50 years. You can play with the numbers, but you cannot change reality.
Your comment about bad opportunities reflect a confusion between opportunities and outcomes. I talked about opportunities and didn’t say anything about outcomes which can be good or bad: you can change jobs or assets to take advantage of an opportunity, but later you may regret the outcome.
Please don’t tell me that you have found a paper–out of a trillion macro papers–in which a distinction is important. If you cannot argue directly about the theoretical relevance of the distinction, then the “empirical evidence” means nothing.
The long term growth rate of the US economy has been 3.5%, and maybe down to 3.25% since the early 1980s..
In the six years of the Bush Presidency real GDP growth has averaged 2.5%. If you throw out the first two years — a valid assumption for evaluating policy –you find that over the last four years real GDP growth has averaged 3.25%. So this Bush boom you are describing is to achieve average growth at best and maybe below average growth. The so called boom has had one year of above trend growth –3.9% in 2004.
Since Hoover the only President to experience weaker GDP growth than Bush II was Bush I.
I know since I went to school many years ago we have had grade inflation so that average performance now rates a high grade in school. But there is no need for such inflation in evaluating economic performance– average to below average performance is still mediocre no matter what spin you put on it.
Spencer, I’m talking about economics. You want to talk about politics. I’m far away from the US and I’m not American. The greatest advantage of the US economy is that it depends so little on politicians. You should know that Al Gore didn’t invent Internet and that neither Clinton’s polices nor Bush’s have been a significant determinant of the great performance of the American economy in the past 15 years (BTW, it has been great despite Greenspan and Bernanke).