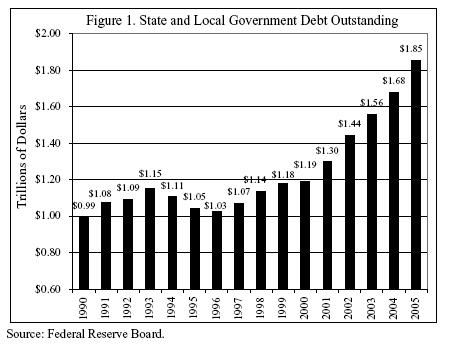
State and Local Debt Soaring
The Cato Institute reports that the debt for state and local governments is soaring. State and local government debt has increased by 39% going from $1.19 trillion to $1.85 trillion since 2000.
What is the problem here? Well, one way to look at debt is moving future income to today. That is, I’m reducing my future income to increase my consumption in the future. Now in general this doesn’t have to be bad, unless the things I’m consuming more of provide for little or no increase in my current or future income. For example, borrowing money to increase my current stock of human capital might make me more valuable on the labor market and not only increase my current income, but also future income as well.
For a government the same logic applies. A government might find that borrowing its future income to fund a capital expenditure such as expanding public roads makes sense. The additional revenues generated by improving, maintaining and expanding public roads might more than offset the loss of future income. On the other hand, if the expenditure is for a sports stadium that is unlikely to have any impact on government revenues the borrowing is foolhardy. Similarly if the government is borrowing to meet expenditures like payroll or other spending that will have little or no long term payoff.
Hence, if state and local revenues are currently growing a prudent course would be to reduce debt burdens and try to use more of the pay-as-you-go method. However, since such an idea is actually reasonable count state and local governments to do exactly the opposite.


The issue is bigger than just who spends how much. Compare the four largest states (CA, TX, NY,FL), two red/two blue.
NY and CA have the highest percentage of state GSP (gross state product) as state expenditures (NY is 1.48x TX in state revenue and CA is 1.33x TX in state revenue). Those two states also have the highest expenditure per person (NY 1.65x Texas, CA 1.39x TX). NY and CA also get the most money from the federal government (NY 1.61x TX, CA 1.15x TX). NY and CA had higher debt than Texas (NY 1.47x TX, CA 1.09x TX).
If you spend more, tax more, have more debt (per person or as a percentage of the GSP), that also has to be taken into account.
BTW, for the debt, NY and CA had more debt total (NY 1.5x TX, CA 1.84x TX), debt for private purpose (NY 1.43x TX, CA 1.52x TX), debt for utilities (NY 1.83x TX, CA 2.07x TX) and ‘other’ debt (NY 2.14x TX, CA 3.56x TX). However, NY had the second lowest education debt (behind Florida) with NY 0.83x TX, CA 1.55x TX.