Obama Less Popular Than Bush?
George W. Bush left office as one of the most despised presidents in American history. Could Barack Obama actually be less popular?
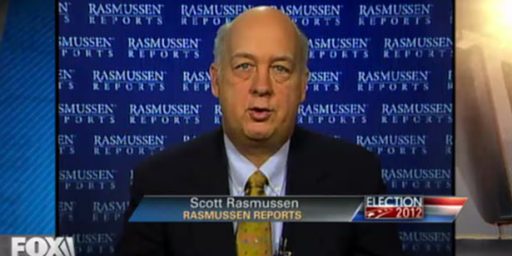
Rasmussen says so: “The Rasmussen Reports daily Presidential Tracking Poll for Tuesday shows that 25% of the nation’s voters Strongly Approve of the way that Barack Obama is performing his role as President. Forty-six percent (46%) Strongly Disapprove giving Obama a Presidential Approval Index rating of -21.” Jim Hoft notes that Bush had a 43% disapproval rating when he left office and quips, “In less than one year Barack Obama managed to pi$$ off more people than George W. Bush.”
Even by the standards of the Rasmussen poll — which most observers agree slants Republican — Obama is still more popular than Bush was in the linked January 5 survey. Bush had only 13% strong approval, compared to Obama’s 25%. Bush’s total disapproval was 62% compared to Obama’s 56%. On the other hand, the combined strong/somewhat approval for Bush was 48% compared to Obama’s 44%.
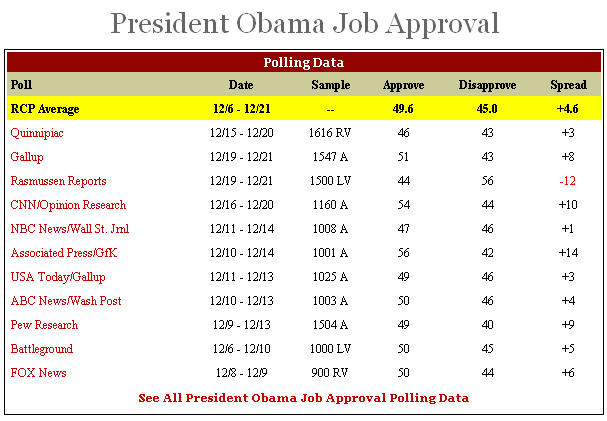
A better indicator of presidential approval is the RealClearPolitics average.
 You can see right away that Rasmussen is an extreme outlier, with an approval rating 5.6 points below average and a disapproval a whopping 11 points above average. And those averages are skewed by the inclusion of Rasmussen’s numbers!
In fairness, however, Rasmussen is purportedly sampling only likely voters, whereas most of the others are sampling adults, regardless of whether they’re even registered to vote. So they’re looking at a different universe of people. This is not only fair but necessary when trying to predict electoral outcomes. It’s rather silly, however, when trying to measure presidential popularity.
via memeorandum


James, are likely voters considered to be better informed, much better informed, or about the same as adults?
Pete,
They’re usually better informed on the issues. It probably matters less, though, on broad, gut-level issues like satisfaction with the president’s job performance.
There is going to be a poll taken in the first week of November 2010. This will be a poll which indicates just how happy the American people are with this Marxist and his left wing colleagues in the house and senate. Most other polls can be affected by how a question is asked. The poll to be taken in November only asks one question. Can you imagine if Bush would have had a picture of a right wing radical on one of his Christmas decorations? Obama has a picture of one of his hero’s, Chairman Mao. Murderer of millions. What does you education in Political Science tell you about that James? Just an error in judgment or and indication of Obama’s politics? You remind me of the people of New Orleans who did not leave town when Katrina came calling, then blamed the government for their predicament.
Pete,
Likely voters are just what they say. Voters who are likely to vote in the next general election. The polsters test this in different ways, but it boils down to questions asked in the poll.
James,
Another big difference for rasmussen is they push for an answer. You will note that most of the other polls don’t add up to 100 with the remainder being ‘I don’t know’. Their approval numbers are generally close to the other poll numbers, but there disapprove numbers tend to equal other polls disapprove and don’t know combined.
I agree that that the idea is a bit premature. On the other hand, Obama has managed to run up more debt in one year than Bush did in 6. That 6 to 1 ratio seems to be a better mark to compare. Look at Bush 6 years in to Obama one year in (though we are about a month shy of one year).
Given that no one could turn the economy on a dime, and that no one reasonable would yank the troops on a dime, it kind of is what it is.
Well, I would not have guessed how corporate-friendly Obama and the Dems would be on Wall Street and Health care.
Even as the Zelsdorfs of the world say “Marxist” another thing entirely happened.
Dr. Joyner:
“Sampling only likely voters…rather silly, however, when trying to measure presidential popularity.”
Sampling all adults is rather silly when so many of them so ill-informed an uninvolved. Who cares about the political opinions of Americans who aren’t paying attention and aren’t going to vote? It’s trivia.
Here is an interesting slice of Rasmussen’s numbers:
*Strong Disapproval of Bush at the end of his 2nd term: 43%
*Strong Disapproval of Obama Now: 46%
P.S. It’s disingenuous to say that Rasmussen is extreme outlier simply because he is sampling likely voters. Do you consider Quinnipiac’s polls of registered voters to be outliers as well?
Also, using the word “purportedly” to describe Rasmussen’s polling methods conveys a sense of delinquency that he surely has not earned.
…aside from the issues noted above, this is a great post, doc. Keep up the good work.
James, but if they are going with their gut, isn’t that gut feel more closely associated with how they are doing personally? How could they form an intelligent opinion of someone’s performance if they were unfamiliar with the issues related to that performance?
I was surprised by this poll:
PPP survey of Dec. 9
I can accept the abstract proposition that a President isn’t meeting expectations, but the notion that if an election were held today, Obama could theoretically lose to George W is astounding. Maybe it’s because Obama keeps talking about him as if he’s the alternative.
Rasmussen is an extreme outlier because his numbers are wildly different from every other poll in the mix. Quinnipiac is pretty close to the average.
You apparently use the word differently than I do. Or as it’s defined in the dictionary.
Also worth mentioning: using the difference between “Strongly Approve” and “Strongly Disapprove” as a measure of popularity has no validity whatsoever,
Agreed. I glossed over that because I couldn’t figure out what the hell he was trying to get at with that.
Blumenthal had a nice write-up on the Rasmussen effect a few weeks ago. Link Three explanations:
1. Likely Voter (James Joyner’s and Scott Rasmussen’s theory)
2. Smaller Don’t Knows (yetanotherjohn’s theory)
3. Automated Polling — Five of the surveys that don’t use live interviewers give Obama the lowest scores, suggesting perhaps that people are more willing to express disapproval to a machine.
Of course, could be a little of each.
Rasmussen may be an outlier, but it has also been the most accurate over the last few years.
Rasmussen is an extreme outlier because his numbers are wildly different from every other poll in the mix. Quinnipiac is pretty close to the average.
Polling is supposed to be about accurately measuring a phenomenon, not about lack of variability amongst a cluster of polls. This outlier gambit is a red herring. What matters most is accuracy. In other words, if Rasmussen is more often than not more accurate with predictions that are tested against measured outcomes, then quite simply, they’re a better source than all of the more clustered, but inaccurate, polls.
What distinguishes many of these polling companies from each other is their methodology. The methodology impacts on reported results. So too does poll design and process, but the end result must always be measured against accuracy, not cross validity to other polls.
Poll Accuracy in the 2008 Presidential Election
The line graphs of approval statistics are different for every President. JFK had high numbers from his inauguration until his assassination (no irony intended). Bush 41 was elected in a quasi-landslide, and presided over a successful and popular war, but nosedived at the wrong time.
By contrast, Bill Clinton and Ronald Reagan both sunk below 40% in their first terms, yet both won re-election handily. And the comparison between Obama’s first year, and perceptions of Bush that had congealed over the length of his two terms of office, is simply so fallacious that it reflects badly on Rasmussen for raising it.