One Polling Chart To Rule Them All
If you're looking for a reason why the GOP is likely to do very well tomorrow, voter response to the "right track/wrong track" question is a very good guide.
For many years, pollsters have used the right track/wrong track question to test the mood of the public on the state of the country. It has invariably been a fairly good predictor of the fate of the incumbent party. In 2008, for example, just three weeks before the election, 89% of those polled said the country was on the wrong track. Three weeks later, Barack Obama was elected President.
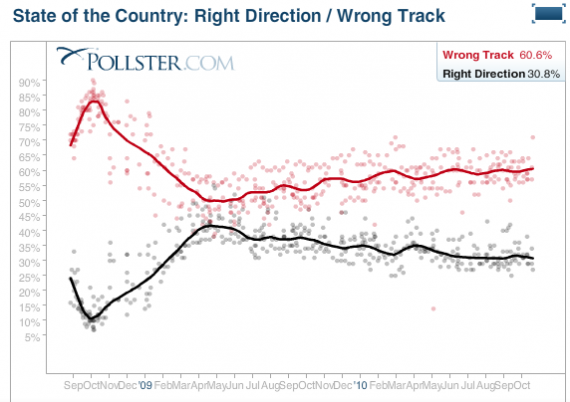
It’s also possible to track the results on this question over the course of Obama’s Presidency:
It’s very easy to see the story of the first 19 months of the Obama Administration in this chart. After Barack Obama won the election and assumed the Presidency, public optimism about the direction of the country was on the upswing. Ironically, this occurred during some of the deepest months of the recession, but it’s a fairly understandable, and rather common, reaction to a new Presidency.
It’s also worth noting when the contraction stopped and the public mood began to sour again. It started in the months after the stimulus package was passed and the Obama Administration and Democratic in Congress turned their attention to health care reform. In the meantime, people continued to lose their jobs and, while the economy officially went out of recession in July 2009, large segments of the country continued to feel economic pain that has continued to this day. This was when we started to see the town hall protests against health care reform, and the beginnings of the Tea Party movement. As 2009 went on, the job losses continued and Republicans picked up Governorships in New Jersey and Virginia and, most improbably, Ted Kennedy’s old Senate seat in Massachusetts. From there, the Tea Party movement took off like wild fire until it brought us to where we are today, on the verge of the third historic “change” election in a row.
With less than twenty-four hours to go before polls are open nationwide, the two most recent polls from CNN and ABC News show the “wrong track” number at 75% and 71% respectively. That’s higher than it was in either 2006 or 1994, although not quite as high as it was in 2008 in the immediate aftermath of the financial crisis. For any member of the incumbent party, that’s bad news indeed.
Voters are anxious about their own futures, and the future of the country and they’re about to give the GOP a great deal of power because of it. How long that lasts will depend largely on whether or not — in 2, 4, or 6 years — voters still think we’re on the “wrong track,” or whether they think we’re finally traveling in the right direction.



I hate the right track/wrong track poll because it doesn’t say anything about why the person thinks we’re on that track. People can use it to mean whatever they want it to mean.
@CamdenRave: That falls into the category of true but irrelevant. Aside from the most die hard partisans, people tend to vote based on a vague, visceral sense that things are going good–and we should therefore stick with the current party–or not–in which case we should throw the bums out.
Camden, it’s a little like the alcohol study ;-), we can take something from it without arguing that it has to be the whole story.
I think it’s interesting that we never crossed over 50% “right track,” even in the “mania.”