Most Common Immigrant Groups By State
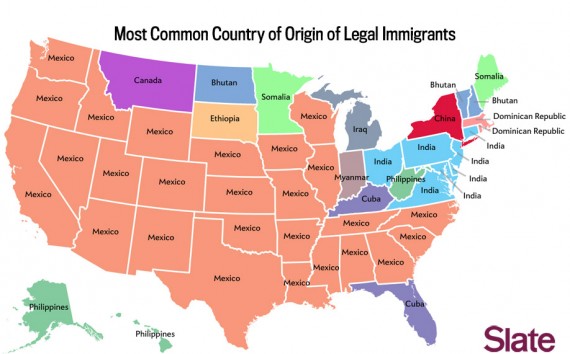
Slate’s Ben Blatt is having some more fun with maps and demographic data, this time to show the most common origin for legal immigrants in each state.
Here’s the map (click to enlarge):
The fact that India is the most common source of immigrants for New Jersey doesn’t surprise me all that much. Even when I was growing up there, at a time further in the past than I may be willing to admit, there had been a huge influx of Indians into the area, especially in the area around Rutgers University. Many of them were engineers and engineering students drawn here for an education, but many of them also ended up working at AT&T’s Bell Labs, Johnson & Johnson, and the many other pharmceutical companies that had planted roots in the Garden State years ago. Over time, the immigrant pool from that country less oriented toward the sciences, in no small part because family members followed in the wake of their immigrant relatives. I’m somewhat more surprised to see India is also the predominant source of legal immigrants in Connecticut, Ohio, ad pretty much the entire Mid-Atlantic stretching down to Virginia but I suppose the reasons that this group settled in those areas were similar to the reasons they ended up in New Jersey.
That Mexico is such a large chunk of the immigrant population is, of course, not a surprise. Neither is the fact that Cuba is a the predominant source of immigrants in Florida (although why that’s true in Kentucky too is beyond me). Some of the oddities, though include North Dakota, which apparently has a large population from the tiny Asian nation of Bhutan, Indiana, which seems to be the destination of choice for people from Mynamar, and the fact that the largest immigrant group in West Virginia is from The Philippines.
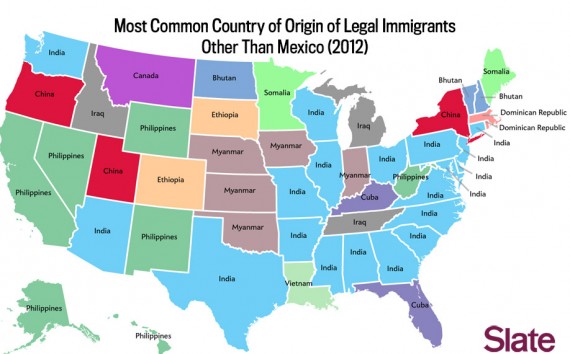
Things get more interesting when you take Mexico out of the picture completely:
Now, India takes a much more prominent role. Although it should be noted that, according to the most recent census, the actual number of Indian-Americans in the country numbers approximately 1.8% of the countries population.


Note to self: try more Indian food.
Note that the map is based solely on people granted legal immigrant status in 2012; it doesn’t say anything about the relative size of the legal immigrant populations overall, much less the ethnicity distribution of the states.
Why would Somalis want to move to Maine and Minnesota?
@Stormy Dragon: Because the frozen wastelands that are those two actually quite beautiful states, are much preferable to the libertarian paradise that is Somalia. I’d suggest having access to food, education and police protection might have something to do with it. Also certain regions will make immigration easier for certain ethnic groups, it’s why Minneapolis/St. Paul formerly was home to waves of Hmong immigrants in the 70’s – 90’s and now has so many new Somalis.
I’m just going to point out that Bhutan currently has a population of about 730,000, and yet the country is the most common country for legal immigrants in North Dakota, Vermont, and New Hampshire…
—
Also, this is clearly bait for superdestroyer and bithead.
Ok, this explains it.
No comments on Iraq invading Michigan? Surely that should draw some right-wing fire.
@Franklin: and Idaho!
The Michigan Militia is doing a piss poor job if you ask me.
Interesting. Back in the 1970s/80s, there was a huge influx of Punjabis — from both India and Pakistan — into western MA. They displaced both African-Americans and Puerto Ricans as the major minority.
@trumwill: And Tennessee?!
What attracts the Chinese to Utah?
@michael reynolds: don’t eat it too late, you’ll be up all night!
i know somalia is pretty messed up, but moving to minnesota from there must be some serious shock once winter hits.
@trumwill: I missed that … hmm.
I’m not that surprised about the Indians in Connecticut, I would wager a lot of them are hopping the train in the morning to New York City for jobs in IT and engineering related fields (yes, I know I’m being stereotypical).
I’m not that familiar with Ohio’s economy, but some might be commuting to Pittsburgh which has a lot of science and engineering companies there now (Intel, Apple, and Google, just to name a few).
I’ll say it again — this map refers only to people who arrived in 2012, which is a very small fraction of the entire legal immigrant population. Some of those states (North Dakota, anyone?) probably represent a small sample of people, with perhaps an atypical mix of nationalities for that state.
It would be much more informative to show the most common nationality (and raw numbers) for all legal immigrants — if not by current state of residence, then at least by state of admittance.
@Stormy Dragon:
Refugee sponsorship.
@Tillman: all those hot mormom girls looking to wed and share their man?! and somewhat clean air to breathe, can’t discount that.
@DrDaveT:
but not nearly so easy to do