On the Number of Parties 4: The Oddity of Two, Part 2 (A Note on Historical Stability in the House)
More on the US party system.
So, I am working on a conference paper on the effects of candidate selection processes on party system formation looking at the US and Colombia. As part of that process, I wanted to look at the long-term structure of the US party system. As I noted in the previous post in this series, the US has a remarkably stable two-party system in a way that it is, well, exceptional. I decided to go ahead and calculate the effective number of parliamentary parties for the entire history of the US House (rendered as either Ns or ENPP–which I discussed here).
Now, to be honest, I didn’t really need the calculations, as one can easily eyeball the data and know what you are going to get. Still, I do like a good graph and find the act of empirically confirming the obvious to be of use (that it may be a way to procrastinate in regards to actually writing is a scurrilous smear!).
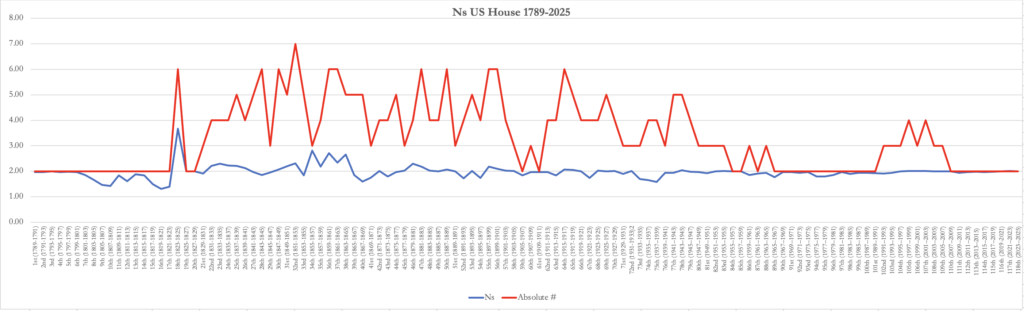
So, I took the Party Divisions of the House of Representatives, 1789 to Present as provided by the US House of Representative’s website and did the Ns calculations, and also took account of the absolute number of parties winning seats in the House (as classified on the site) which is the red line. The absolute number of parties winning seats treats even one independent seat as a separate party.
It is noteworthy that while there was some third-party activity in the 19th century (and even into the early 20th), the effective number stays right around 2.0 on balance. Indeed it only goes above 3.0 one time (the 18th House).
Some noteworthy observations:
- The mean, median, and mode are 1.97. You can’t ask for more consistency than that! (Indeed, to really get the mode I have to go to 5 decimal places: 1.97288, which happened three times (the 91st, the 93rd, and the 97th).
- The last time a named third party (i.e., not an “independent”) won a seat was at least the 88th (1962 elections) when an “Independent Democrat” won a seat, at least if I go by how the House historian classifies winner. I would like to know more about what “Independent Democrat” means to make a full judgment. Before that, it was the American Labor Party, which won a seat in the 1948 elections.
- The only time the House has had an effective number of parliamentary parties above 2.x was the 18th (1823-1835) when the number was 3.67. Six different factions had seats, mostly linked to which presidential candidates they supported. There were three larger parties, controlling between 33.8% of the seats and 23.9%, and three smaller parties all controlling less than 10%. Of course, the 18th Congress also had to elect the president in 1824 when no candidate commanded a majority of the Electoral College. Hence the House divisions were reflective of a broader national division. This was also in a period during which the party system was still forming at was at the doorstep of mass parties.
- The high water mark in terms of the absolute number of parties was 7 in the 32nd (1851-1853).
- You can see some (granted minor) volatility in and around the Civil War period.
There are, of course, a host of caveats to be laid down about the evolution of democracy (including rather important suffrage questions) over this period of time and a deeper dive into topics like ballot control, nomination processes, and even exact electoral procedures.
I will add, somewhat to the point of the prior entry in this series, I am fairly certain that no other democracy in the world would produce as stable a graph as this one (except, maybe, some very small commonwealth countries in the Caribbean).
Still, it is interesting (to me, at least). And I figured if I was going to do the work, I might as well get a blog post out of it in addition to whatever usefulness it ultimately provides for the paper.
Previous entries in this series:
“Independent Democrat” is probably Richard Fulton, Tennessee 5 district:
(who seems a Democrat with some local conflict with other Democrat)
https://history.house.gov/Institution/Election-Statistics/1962election/
https://en.wikipedia.org/wiki/Richard_Fulton
Or perhaps on the increasing instability of Representatives?
eek! drink!
🙂
When a stable party system leads to an unstable political system, methinks we are in for interesting times.
(For an arbitrary value of “we”)
Thanks for this. I continue to think it would be interesting to explore the effect this has on actual governance. Does it make it easier for special interests (good or bad) to get their policies enacted? Is there a metric for good and effective governance and does the number of parties correlate to it in any way?
@MarkedMan: I know this is an ongoing question, and a fair one, although I continue to think that you are both over-estimating my claims on this subject, as well as asking too much from one variable yourself.
I think that the core problem in your question is first, what metric/metrics do you think should be deployed for “good and effective governance.”
Second, the issue does go beyond the number of parties to a broader question of the structure of government (e.g., presidential v. parliamentary, to pick one big variable).
But, more importantly, I think the question should be a bit more direct, to include such specific questions as do more parties create better representation of the population in government? Do more parties provide more clarity as to what politicians claim they will do versus what they actually do? Do more parties create more responsiveness in politics? Do more parties create more competition for power? Do more parties create more possibilities for accountability?
And so forth. (All things that I would argue do, ultimately lead, to better governance, but again, we would need to determine by what metric).
@Miguel Madeira: Thanks. Part of my question is whether he really should be counted as a separate party the way the House historian does. I would need to dig some more to determine an answer.