86% Approve of Black-White Marriages
Support for interracial marriage is now almost universal across America.
Support for interracial marriage is now almost universal across America.
Gallup (“Record-High 86% Approve of Black-White Marriages“):
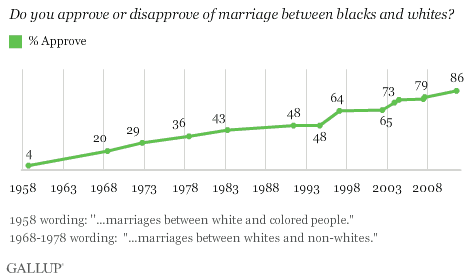
Americans are approaching unanimity in their views of marriages between blacks and whites, with 86% now approving of such unions. Americans’ views on interracial marriage have undergone a major transformation in the past five decades. When Gallup first asked about black-white marriages in 1958, 4% approved. More Americans disapproved than approved until 1983, and approval did not exceed the majority level until 1997.
This is almost certainly the biggest attitudinal change on a major social issue in my lifetime. Interpolating roughly from the trendlines, there was something like 14 percent approval in 1965; it’s now 14 percent disapproval. I graduated high school and college–indeed finished my PhD–with approval below 50 percent.
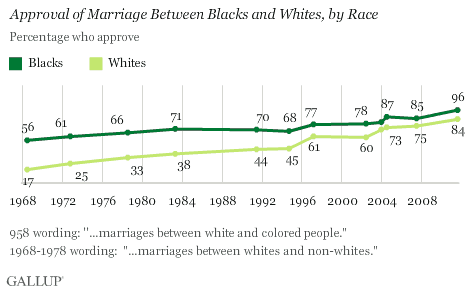
My guess upon seeing the headline was that blacks were holding down the opposition almost equally with whites. That’s not the case at all:
Approval of black-white marriages is at a record high among blacks and whites. Blacks have always been more approving than whites of interracial marriage, going back to 1968 when Gallup first was able to report reliable estimates on each group’s opinions. However, the gap in approval ratings has narrowed considerably, averaging 13 percentage points since 1997 but 32 points from 1968-1994.
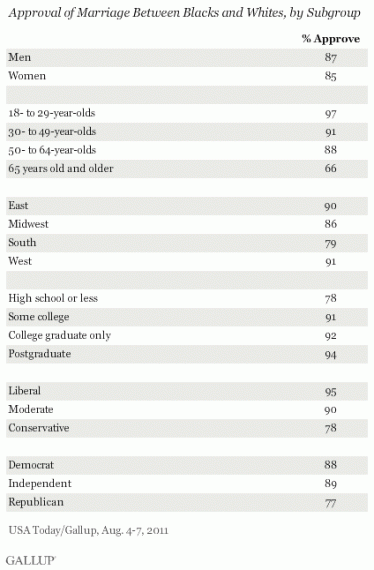
Not surprisingly, approval is lowest in the South, among the elderly, those with a high school education or less, conservatives, and Republicans. But all those groups except the over-65s are tracking only four years behind the nation as a whole; the elderly are stuck in 1993:
Truly remarkable.


Off topic comment deleted.
We’ve come a long way, fairly quickly. The below-majority level of approval just back in the 90s was a surprise to me.
I am truly surprised. I clicked thru just to see if there was a regional breakdown (there was not), because in this neck of the woods, the only thing worse than marrying a black is being gay. This area is stuck back in 1868, but it is fairly representative of the Ozarks and, I suspect, some rather large swaths of the south as well.
Good news.
I wouldn’t quite say it is universal James.
86% approval means one out of seven disapprove. Given the perfectly fair assumption that most all of those disapprovers are conservatives, and assuming that conservatives make up around 40% of the population, then it seems that just about one out of every three conservatives is opposed. That is still rather substantial.
@Tano:
Since the post includes the data of 78% approval for conservatives, its about 1 in 5 that don’t approve, Why not read instead of making wrong assumptions?
What I would like to know is how tied this belief is to racism in general. Does that 97% approval of 18-29 years old indicate that much less racism? That would be good news.
Among those who disapprove, arguably unreconstructed racists, they are largely white, southern, old, conservative and Republican. In other words, the same demo as the Tea Party.
A fact which surprises no one who has been paying attention.
@michael reynolds: There’s a huge overlap in the demos, with the elderly pulling down the numbers generally. And the South and the GOP are where the country was a mere four years ago; I call that good news.
Another issue where one faction of the nation was absolutely wrong-headed in it’s views, and fought like hell to resist seeing what was right.
How many issues do we see like that today? Gay rights. Climate change. Revenue increases. The list is long.
Why do they keep forcing us to go through this fight time after time? I know change can be scary. Man-up Tea-Baggers.
@michael reynolds:
Hmmmm… I looked at it and didn’t see that ‘fact’ in the data. I can derive that of the approx 15% that don’t approve, they are mostly old (65+), and are more white, southern, and conservative.
@Hey Norm:
More made up data to conform to the view you already hold? The data seems to show that multiple groups held these views to various degrees over time. Do you mean people of the Tea Party by your derogatory term? Some how I must’ve missed the data showing the Tea Party’s view on this subject, I only see Republicans, Democrats, and Independents that were polled by party affiliation.
Which also describes the Teavangelicals.
It’s hard to admit you are wrong. But getting past the denial is an important step. And it will make the country a better place.
On the one hand this is great, in that things have improved significantly.
On the other… wtf is wrong with the 14% who disapprove? Ugh.
Overall, it’s good news.
@Hey Norm: It certainly does seem hard for you to admit you’re wrong. This Gallup data certainly doesn’t gainsay anything I put out there, but I would like to see more recent data. What about you? Do you have any real data or are you just using the ‘PIDOOMA’ methodology?
More proof that we are on the slippery slope towards having a legal, federally recognized polyandrous marriages with farm animals, illegally imported foreign cars (I have a right to have that steering wheel on the wrong side… I was born that way!), and the corpses of second cousins.
@rodney dill: While I agree that we can’t *prove* a direct correlation. That said, there do seem to be some crossovers — especially when you do a meta analysis of the demographic data out there on the tea party (this is from Wikipedia, which has links to all the source material on the page:
Pew has found a strong correlation between Tea Party supporters and evangelical and protestant view (and an agreement that religious beliefs greatly effect their stances on issues) – http://www.pewforum.org/Politics-and-Elections/Tea-Party-and-Religion.aspx
As far as the Southern thing… that’s a little harder to get at. The most immediate thing to point to is the fact that when one breaks down the HOR’s Tea Party Caucus, the vast majority of representatives come from states associated with the South (see listing here: http://politicalticker.blogs.cnn.com/2011/07/29/who-is-the-tea-party-caucus-in-the-house/ and graphs here: http://www.salon.com/news/politics/war_room/2011/08/02/lind_tea_party/ )
Does this mean that there’s a 1:1 match? No. But there does seem to be a lot of potential crossover.
@mattb: …and I don’t argue that mattb. I did state that based on just the data in this post that —
What I was having fun with was those trying to derive information from the “Approve Black-White Marriages” poll that wasn’t really supported by that poll.
I found this portion from Wikipedia of interest.
…and your closing comment sums it up nicely.
That would be correct (though ‘a lot’ seems a little nebulous). Too bad other commentors aren’t as careful in their choice of words.
@rodney dill: The Gallup and ABC polls are worth noting. For the moment, though, they should be classified as outliers. It’s too bad Pew (or really anyone) hasn’t done anything recently as far as Tea Party Demographics… most of the polling I fund was pre-November 2010.
The big problem with anything Tea Party related is trying to separate out the degrees of affiliation: supporter versus someone who actually organizes/attends events. Plus, for at least a bit of time, probably cresting in 2010, the Tea Party was arguably the “politically correct” position for disenfranchised republicans (why so many “independents” claimed support/affiliation).
I agree with your point that one shouldn’t read too far into the Marriage Data. An thanks for noticing the care I try to take in choosing words…
Hm, approval rates of 77% Republican, 88% Democratric, 89% Independent. Pretty small difference actually. Which is encouraging.
Just some random observations
1- Interracial marriages were frequently featured on shows like Phil Donahue. I recall one of those being on the day I processed at MEPS in 1979.
2- Most White-Black marriages are White female Black male. I don’t know what the exact statistics are.
There are theories on why this happens. Just like there for those white male asian female relationships.
3 I’m a white male married to an Asian female who I met while I served in the military. Oddly enough, my last gf before I met my wife, was black. She and her family were from Jamaica.
The wife and I have never encountered prejudice or discrimination. I can’t recall us even getting a dirty look. It wasn’t the same with the gf I mentioned above. I was living in the Wash DC area at the time(Stationed at Bethesda). It’s good to see people are more color blind.