Problems For Obama Among Blacks In North Carolina? Don’t Believe The Poll
A new poll purports to show the President losing 20% of North Carolina's African-American vote to Mitt Romney. Don't Believe It.
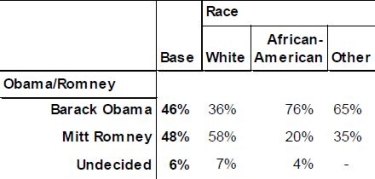
Given the fact that President Obama won North Carolina by less than half a percentage point in 2008, it’s not entirely surprising that the latest Public Policy Polling poll is showing Mitt Romney pulling ahead of the President in a state that has been traditionally Republican in Presidential elections going back all the way to 1980. What is surprising is something that Business Insider found while delving into the cross tabs:
20% of the African-American vote for Romney? That’s actually quite a shock considering that Obama won 95% of the African-American vote in 2008. The number is consistent with Obama’s approval rating in the state, where the polls shows that some 21% of African-American respondents had a negative opinion of the job the President was doing. That’s quite different from nationwide polls where the President’s job approval rating among African-Americans has been consistently near 90%. Moreover, the most recent non-partisan poll of the state had Obama winning African-Americans 84% to 8%, and a poll by Republican pollster Civitas had Obama winning African-Americans 89% to 2%. More importantly, an April PPP Poll [PDF] had Obama beating Romney 90% to 7% among African-Americans with an Approval/Disapproval rate of 91%/7%. The crosstabs from PPP’s May poll in North Carolina are unavailable for some reason but I would be their numbers are about the same.
PPP concedes that this is “an unrealistically low share” of the African-American vote for Obama.
So what’s going on here? Is this the first sign that the President’s shift on same-sex marriage has really hurt him among religious African-Americans? Well, that’s undoubtedly how some on the right will spin it, but there are several caveats here. African-Americans constituted some 22% of total poll respondents. While this is roughly consistent with the state’s demographics, it means that, of the 810 poll respondents, 178 of them were African-American (or at least identified themselves as such). This is a pretty small sample size and the margin for error for this individual demographic would be fairly high, at least in the 6-11% range one would guess. It’s also worth noting that PPP is an autodial poll that doesn’t use human operators so it relies on people responding via their telephone keypads, and doing so truthfully. Its possible that we’re seeing false responses here, or bad sampling. At the very least, unless we see something like this replicated in other polls of the Tar Heel State, there’s not really any reason to believe that it’s true, or that the President is really in trouble among members of his most loyal demographic group.
Update: Nate Silver weighs in on this poll and, while he does agree that losing in North Carolina is bad news for the President, he’s as skeptical as I am about the numbers for African-Americans:
The poll surveyed 810 North Carolina voters, and weighted its demographics such that 22 percent were African-American. If you do the math, that suggests that about 180 respondents in the survey were black.
The margin of error on a 180-person subsample is quite high: about 7.3 percent.
And that probably underestimates the real margin of error somewhat. The 22 percent African-American figure in the poll represents the results after demographic weighting. However, some demographic groups are considerably harder to get on the phone than others, African-Americans among them. Since the incidence of cellphone use is considerably higher among African-Americans than among white Americans, this difficulty will be especially true for a polling firm that does not include cellphone voters in its sample, as Public Policy Polling’s surveys do not.
In practice, it is possible that Public Policy Polling got something like 100 African-American voters on the phone rather than 180, which would be associated with a margin of error of about 10 percent. In addition, all of these African-Americans were reached on landlines, and they may have different demographic characteristics (for instance, being older) than the cellphone voters that the survey missed.
A more robust sample of African-American voters comes from the Gallup poll, which interviews about 3,500 people a week for its national tracking poll and does include cellphones in its sample.
The Gallup poll suggests that Mr. Obama’s ratings among African-American voters may have dropped by a percentage point or two over the past few weeks, but probably not more than that. In the four full weeks of polling since Mr. Obama announced his support for same-sex marriage — which had been unpopular in the African-American community until recently — his approval rating has averaged 86 percent among black voters. That compares with 87 percent for 2012 as a whole.
(…)
There just isn’t any indication that there is much going on here, other than statistical noise. Although Mr. Obama may not win 95 percent of African-American voters in 2012, he will surely win an overwhelming majority of their support. Mr. Obama has much bigger problems to worry about.
There is nothing theoretically wrong with looking at Mr. Obama’s support among different demographic subgroups. But doing so can lead to some bad analysis — sorry, there’s no polite way to put it — if you aren’t alert to this very basic issue of sample size.
Furthermore, keep in mind that in addition to the already-high margin of error related to polling demographic subgroups, the margin of error is calculated in such a way that it is supposed to cover 95 percent of all possible cases. But it won’t cover 100 percent. The results from 1 in 20 polls — or 1 in 20 subsamples within polls — will fall outside the margin of error.


Even Zogby wouldn’t come up with polling results this far removed from reality.
Agreed. There has to be something wrong in PPP’s sample somewhere
@Doug Mataconis:
The issue here is this that there’s only a 95% certainty that the true result of the question asked lies within the margin of error, which in the case of this poll would be around 6-7%.
So, 1 in 20 polls will be wrong, and unless there will be a number of polls showing Obama only getting 76% among African-Americans, then, most likely, this will be one of those.
At a standard 95% confidence level, the margin of error is approximately equal to 1 over the square root of the sample size – thus here 1/sqrt 178 or roughly 1/13 or about 7.5%.
Of course this assumes that the sample was representative of the population, it does not account for the case where the sample is biased – the major source of error for such polls.
Well, according to the most recent Census African-Americans accounted for 22% of the population of NC so it was at least representative in that respect. That doesn’t deal with the other identified flaws of course
@PJ:
Actually, that would be the case only if the all the polls had perfectly representative samples of the underlying population. Even with such perfection, the nature of sampling would mean that 1/20 would be outside the confidence level.
In the real world, having a sample that is biased relative to the underlying population is a really easy thing to do. At that point, the margin of error is rather irrelevant – the poll will be wrong for wholly different reasons.
For an extreme hypothetical example, in the case under discussion here, if the 178 blacks in NC were chosen from the list of black Republicans, then although the margin of error would be 7.5%, and the confidence limit 95%, we could be assured with 100% certainty that the result was not representative of the population of blacks in NC.
@Tano:
True, but since I don’t believe that PPP are either skewing their sample or having problems getting representative samples I didn’t see a reason to bring it up.
I think its in the weighting. PPP didn’t poll 178 African-Americans; it polled X African-Americans and then adjusted the numbers as if it had polled 178 African-Americans.
Nate Silver points out the poll had demographic weighting:
Seeing how there are other surveys showing a drastic increase of support among black voters for same-sex marriage after Obama’s speech, I’m going with polling errors.
This is consistent with what I have been hearing on the talk radio and in the papers. Remember, a lot of black voters voted for the marriage amendment. They feel that Obama has done nothing for them, and the economy is hurting them worse.
@Racehorse:
What this is Racehorse, is a case of conservative wishful thinking jumping all over a poll that may well be flawed in a very serious respect. Show me a few more polls that echo this shift among African Americans and I’ll start believing it.
Right now, color me skeptical
@Racehorse: Give it up, Racehorse. There are no sheep here. Black folk aren’t going to desert the first black president, even those who reside in North Carolina.
@Doug Mataconis:
Unforced puns are the funniest! Good one, Doug.
@Racehorse:
Seriously? You seriously wrote that? And you wonder why so many of us keep asking for thoughtful conservatives to start posting to OTB.
(Channeling Rush) “My Friends” this is a great example of everything that’s wrong with “conservatives” like Racehorse.
Racehorse, let me remind you that prior to the 2006 election “the talk radio” promised a landslide victor for Republicans (I’m sure you remember Rush’s day after “I’m through carrying water for the Republicans” confession). Likewise, according to “the talk radio” we should have a President McCain right now.
So if you’re looking for “the talk radio” to do anything than tell you what YOU want to hear (ie. Obama is going to lose big and “the blacks” will abandon him), let alone attempting to cite it as an unbiased source, you’re not exactly portraying yourself out as someone interested in facts as they actually exist in the world.
Historically though, African-Americans have voted Republican.
If by history you mean “ignoring everything that has happened in the last 50 years”
@Racehorse:
So, they (Black Voters) will abandon President Obama because a Republican Congress has blocked him from doing anything for Black voters?
Well, okay than.
@Racehorse: Inside the bubble is no place in which to reside. FYI, the chances of Obama receiving less than 10% of the black vote in any state are about the same as Romney’s chances of being named leader of the Southern Baptist Church.
@Doug Mataconis: Its all about how you sample.
Indeed, and sampling recent history is a much better guide than what happened before FDR and the New Deal…
I am a conservative and I agree. It is just one poll and a small sample. However I would just add that PPP normal tilts Left, and given how far off they have been from other polls in other states , I would put the Romney advantage closer to 6-8 then 2 in North Carolina.
@Kevin Snyder:
The RealClearPolitics (a GOP leaning site) has a summary of recent polls in NC (and most other states). They list PPP – Romney+2, Civitas (A Republican firm) – Romney+2, SurveyUSA – Romney +1, and Rasmussen(a decided GOP leaner) Romney +8. The RCP average is Romney +3.3.
So no, PPP is right in line with the average scores, and the race there does seem to be quite close. Only Ras, as usual, with their 5-6 pt GOP lean, is the outlier.
@Tano:
I am looking at polls of other states where PPP is 6-8 points off of everyone else in other states.
@PD Shaw:
As in, historically, Spain has ruled most of North America; and historically, dinosaurs have roamed the earth.